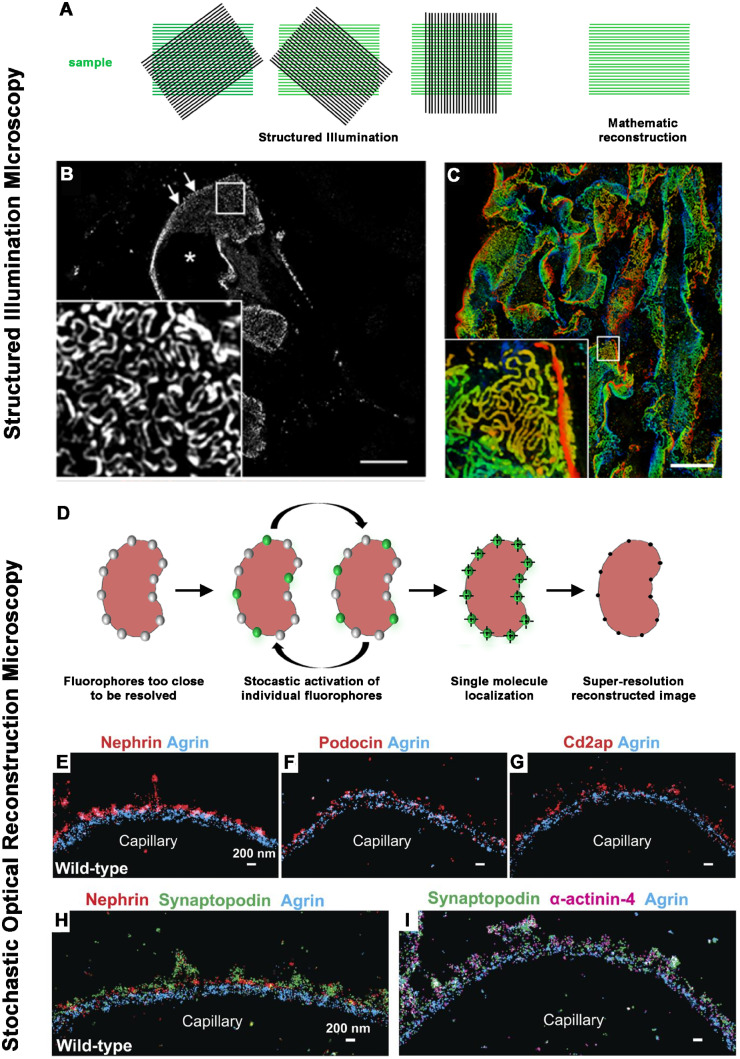
FIGURE 3.
(A) A schematic drawing shows the basic principle of SIM. SIM uses a wide-field microscope setup with a fine-striped illumination pattern. The interaction between illumination patterns and structures in the sample produces moiré fringes, allowing the capture of high-frequency information (corresponding to fine details in the sample) at lower spatial frequencies. By acquiring multiple images with illumination patterns of different phases and orientations, a high-resolution image can be reconstructed. Because the illumination pattern itself is also limited by the diffraction of light, SIM is only capable of doubling the spatial resolution. (B, C) Representative images of nephrin-stained glomeruli after SIM reconstruction. The asterisk indicates the glomerular capillary lumen and arrows indicate the plan view areas on the glomerular capillary. The magnification of the boxed area in (B) shows a regular nephrin staining pattern with a nanometric resolution of the slit diaphragm. Scale bar = 10 µm. Depth coding profile of a 4.5 µm z-stack acquisition (C). (Adapted from Siegerist [36]. This article is licenced under a Creative Common Attribution 4.0 International License. http://creativecommons.org/licenses/by/4.0/.) (D) A schematic drawing shows the basic principle of localization-based microscopy techniques, such as STORM. All these techniques are based on the possibility to cyclically switch on and off individual fluorescent molecules that are too close to be resolved. In these approaches, molecules within a diffraction-limited region can be activated at different time points so that they can be individually imaged and subsequently localized by computationally finding their centres. (E–I) STORM imaging of slit diaphragm proteins to orient the localization of them relative to the GBM (Adapted from Suleiman [39] with permission). (E–G) Double-colour imaging of the GBM protein agrin (blue) and podocyte proteins nephrin (E, red), podocin (F, red) and Cd2ap (G, red) shows that these proteins cluster adjacent to the GBM. (H) Triple-colour imaging of agrin (blue), nephrin (red) and synaptopodin (green) shows that synaptopodin clusters are located between the nephrin clusters. (I) Triple-colour imaging of agrin (blue), synaptopodin (green) and the cytoskeletal protein α-actinin-4 (magenta) shows that synaptopodin and α-actinin-4 clusters have a similar pattern. Scale bars: 200 nm.

