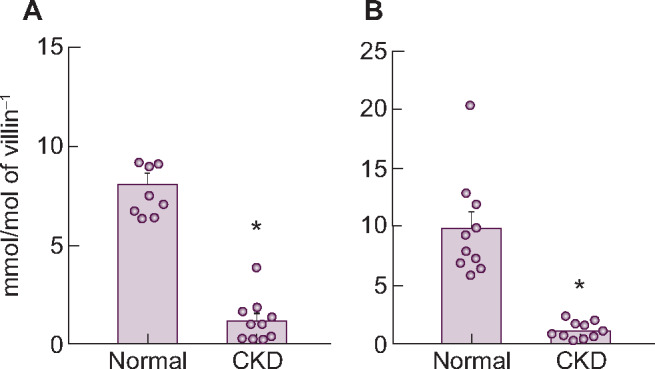
FIGURE 4.

Changes in NaPi-IIb (A) mRNA and (B) protein expression levels in the upper intestine of rats with adenine-induced CKD. Values are normalized by villin-1 protein and mRNA, respectively. The actual values are represented as dots and the columns represent mean + SE. *P < 0.05, significant difference versus normal (Student’s t-test). Normal, normal rats; CKD, adenine-induced CKD rats.
