. 2020 Oct 27;298(1):123–132. doi: 10.1148/radiol.2020201791

Figure 3:

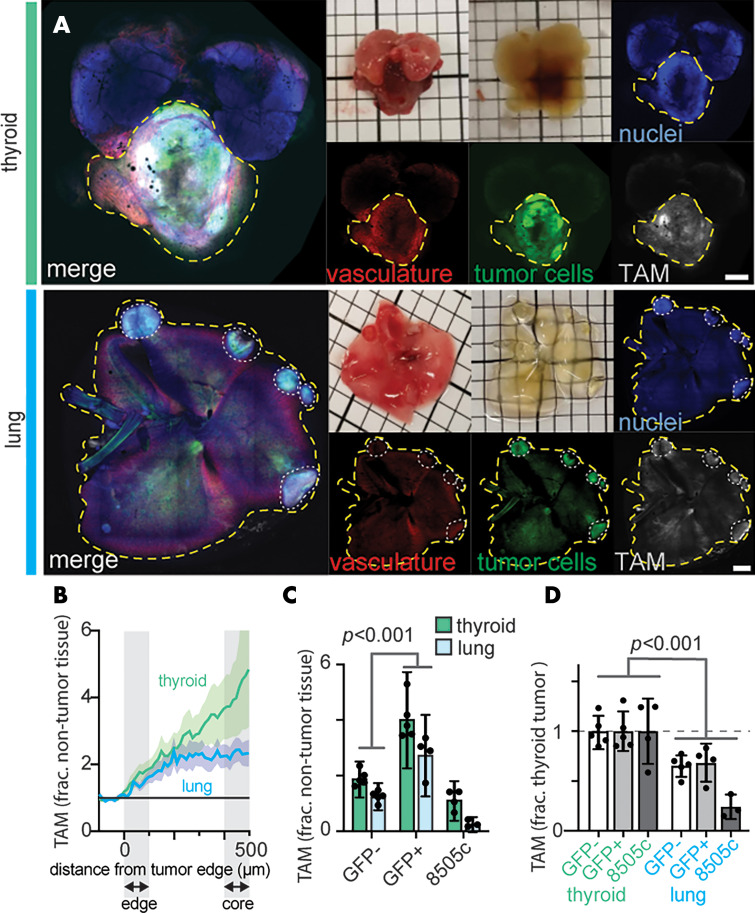
Quantification of tumor-associated macrophages (TAMs) and vasculature in anaplastic thyroid cancer (ATC) lesions by using optical tissue clearing. By using the TBP-3743 model with expression of green fluoresent protein (TBP-GFP) model, tumor cells (GFP positive; GFP+), vasculature (rhodamine-labeled lectin), and TAM (macrin-VT680XL) were imaged in mice bearing thyroid or pulmonary ATC tumors. A, Representative examples of intact thyroids and lungs that were excised, optically cleared, and imaged with confocal microscopy (scale bar, 5 mm). B, Graph shows radial profiles depicting distribution of TAM quantified as a function of distance to the tumor edge from data in A. Thick line and shading denote mean ± standard error of the mean. C, TAM in tumor versus nontumor tissue were quantified from macrin in the TBP (GFP negative; GFP-), and TBP-GFP (GFP+) allograft models, and the 8505c xenograft model. Data are means ± standard deviation. D, Corresponding to C, TAM levels were normalized by their levels in thyroid tumors for each model. Data are means ± standard deviation. Frac. = fraction.

Quantification of tumor-associated macrophages (TAMs) and vasculature in anaplastic thyroid cancer (ATC) lesions by using optical tissue clearing. By using the TBP-3743 model with expression of green fluoresent protein (TBP-GFP) model, tumor cells (GFP positive; GFP+), vasculature (rhodamine-labeled lectin), and TAM (macrin-VT680XL) were imaged in mice bearing thyroid or pulmonary ATC tumors. A, Representative examples of intact thyroids and lungs that were excised, optically cleared, and imaged with confocal microscopy (scale bar, 5 mm). B, Graph shows radial profiles depicting distribution of TAM quantified as a function of distance to the tumor edge from data in A. Thick line and shading denote mean ± standard error of the mean. C, TAM in tumor versus nontumor tissue were quantified from macrin in the TBP (GFP negative; GFP-), and TBP-GFP (GFP+) allograft models, and the 8505c xenograft model. Data are means ± standard deviation. D, Corresponding to C, TAM levels were normalized by their levels in thyroid tumors for each model. Data are means ± standard deviation. Frac. = fraction.