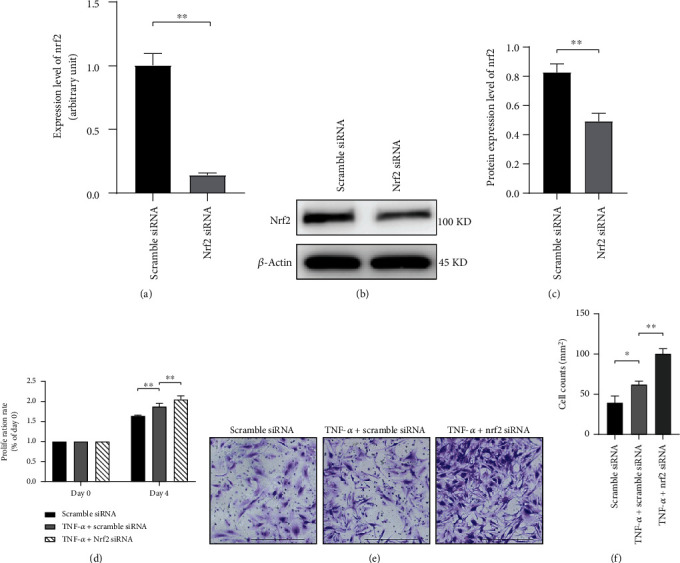
Figure 3.

Knockdown of nrf2 promoted TNF-α-induced proliferation and invasion of RA-FLS. (a) Nrf2 mRNA expression was reduced by nrf2 siRNA transfection for 48 h, as revealed by real-time PCR. (b, c) The protein expression level of nrf2 was examined after nrf2 siRNA transfection for 72 h by Western blotting. β-Actin was used as the housekeeping gene. (d) The proliferation rate of RA-FLS was analyzed by CCK-8 assay after transfection with scramble siRNA or nrf2 siRNA for 72 h. Cells were examined before and after 4 days of culture in the presence or absence of TNF-α (25 ng/mL). The proliferation rate was expressed as the relative optical density (OD) value at 450 nm between day 4 and day 0. (e, f) Invasion of RA-FLS was analyzed with transwell assay after transfection with scramble siRNA or nrf2 siRNA for 72 h. Cells were cultured in the transwell chamber coated with Matrigel in the presence or absence of TNF-α (25 ng/mL). The density of cells that migrated to the lower side of the membrane represented the cell invasion ability, as visualized by crystal violet staining. Pictures were taken at 200 magnification. Scale bar represented 200 μm. N = 3. Data were shown as the mean ± SD; ∗p < 0.05 and ∗∗p < 0.01.
