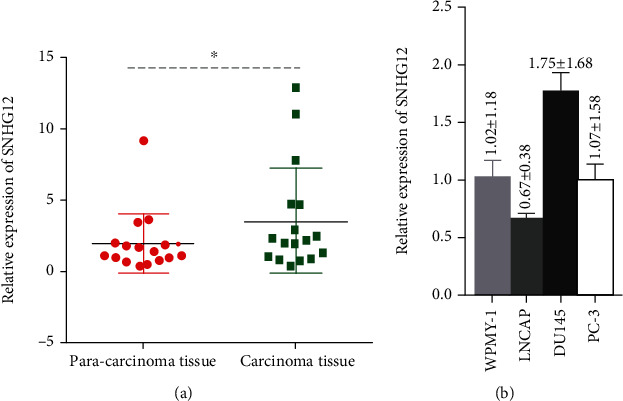
Figure 1.

Relative expression of SNHG12 in PCa tissues (a) and in different PCa cell lines (b) as detected by qRT-PCR. The data are reported as the means ± SD. The symbol “∗” indicates there is a significant difference between the pair of experiments (Student's t-test, P < 0.05).
