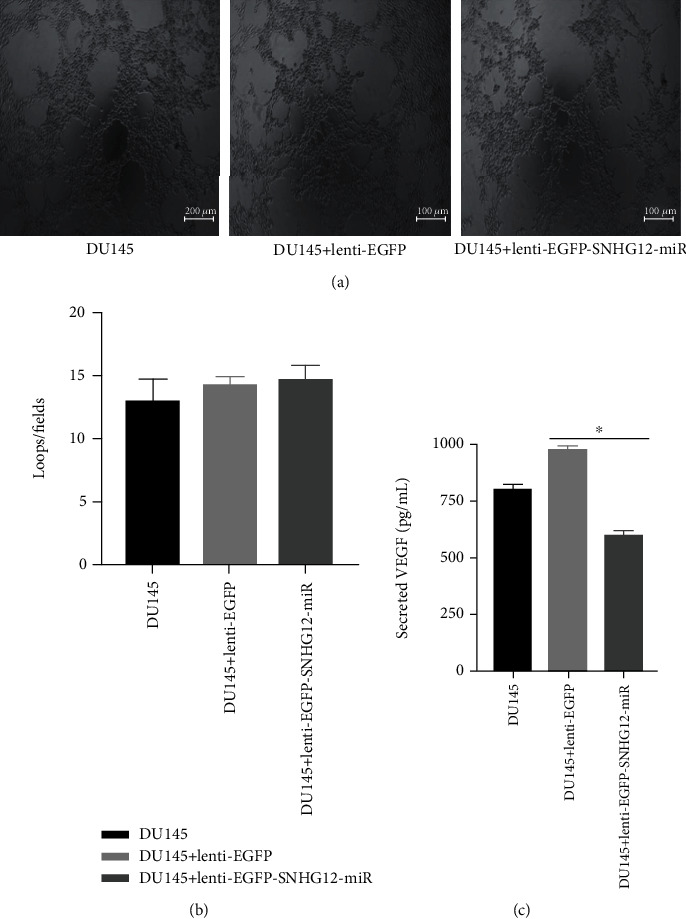
Figure 5.

Effects of SNHG12 knockdown on xxx, shown with images of vasculogenic tubes (scale bar, 100 μm) (a), the number of branch points (b), and the concentrations of secreted VEGF (c) for the three experiment groups: the control group (DU145 cells), empty vector group (DU145 cells transduced with lenti-EGFP), and SNHG12 knockdown group (DU145 cells transduced with lenti-EGFP-snhg12-miR). The symbol “∗” indicates there is a significant difference between the pair of experiments (Student's t-test, P < 0.05).
