
Figure 2.
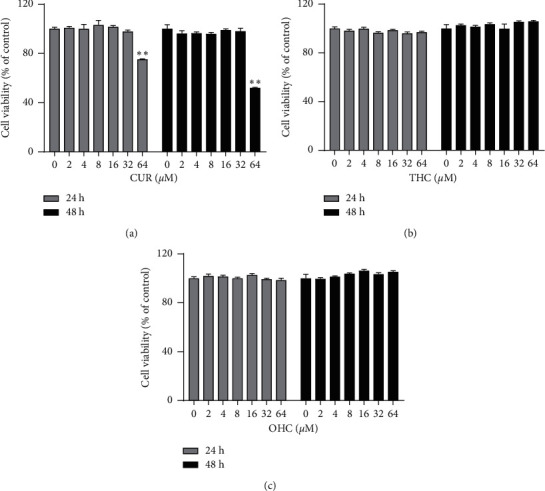
Effects of CUR (a), THC (b), and OHC (c) on cell viability of RAW264.7 macrophages. Data are shown as mean ± SD (n = 3); ∗∗P < 0.01 vs. control group.
Official websites use .gov
A
.gov website belongs to an official
government organization in the United States.
Secure .gov websites use HTTPS
A lock (
) or https:// means you've safely
connected to the .gov website. Share sensitive
information only on official, secure websites.
Effects of CUR (a), THC (b), and OHC (c) on cell viability of RAW264.7 macrophages. Data are shown as mean ± SD (n = 3); ∗∗P < 0.01 vs. control group.