


Figure 3.
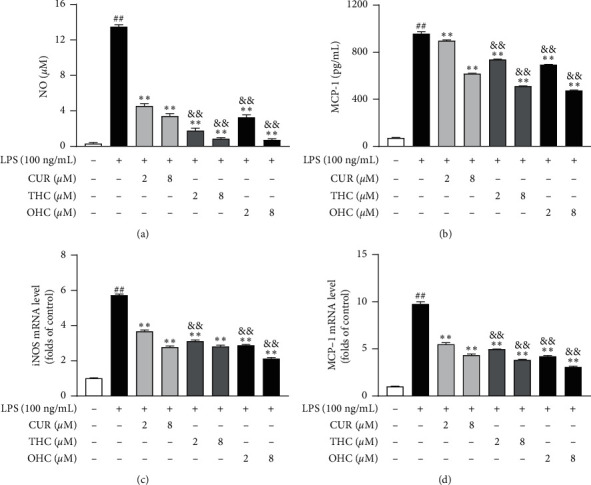
Effects of CUR, THC, and OHC on the productions of NO (a) and MCP-1 (b) and the mRNA expression of iNOS (c) and MCP-1 (d) in LPS-activated RAW264.7 cells. Data are shown as mean ± SD (n = 3); ##P < 0.01 vs. control group, ∗∗P < 0.01 vs. LPS group, and &&P < 0.01 vs. CUR of the same dose.