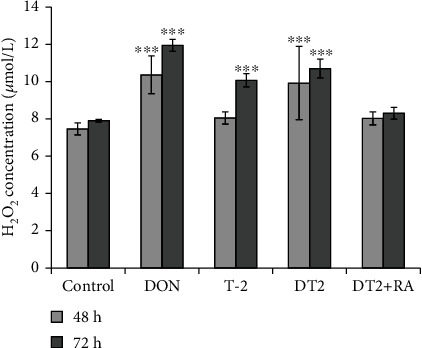
Figure 4.

The changes of H2O2 production after incubation of IPEC-J2 cells with 1 μmol/L DON, 5 nmol/L T-2, DT2 (1 μmol/L DON + 5 nmol/L T − 2), and DT2 + RA (1 μmol/L DON + 5 nmol/L T − 2 + 50 μmol/L RA) (24 h preincubation) for indicated time periods (48 h and 72 h). ∗∗∗p < 0.001 compared to the control values. Data are presented as means ± SD (n = 8).
