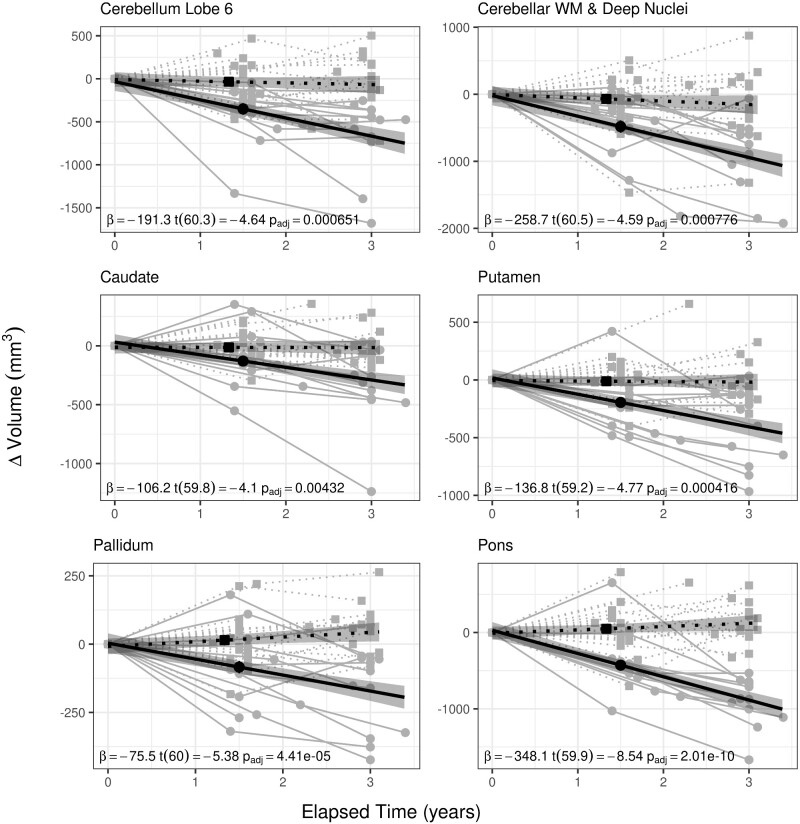
Figure 3.
Group by elapsed time interactions by VOI. Regional brain volumes where volumetric change was predicted by a group (SCA1 affected versus unaffected) by elapsed time (time between visits) interaction. While most brain regions do not change in volume in unaffected individuals, volumes of cerebellar Lobule 6, cerebellar WM and deep nuclei, caudate, putamen, pallidum and pons decrease over time in SCA1-affected individuals. Solid lines indicate values for SCA1-affected individuals, where grey lines and circles represent observed values, and the black line represents the fitted model. Dotted lines indicate values for unaffected individuals, where grey lines and squares represent observed values and the black; dotted line is the fitted model. Shaded regions indicate 95% confidence intervals

