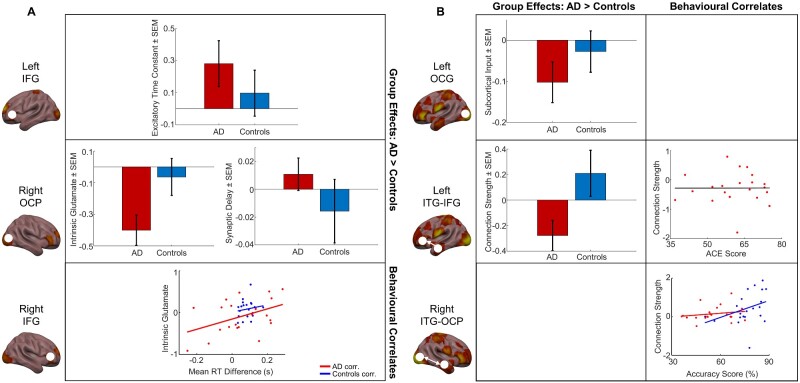
Figure 3.
Model parameters estimated using PEB, for group-level differences and effects of task performance. (A) PEB findings in the priming task. Top: group differences in excitatory time constant between patients and controls in the left IFG, showing mean ± SEM of parameter estimates across participants. Centre: group differences in intrinsic glutamate (centre left) and synaptic delay (centre right) between patients and controls in the right OCP. Bottom: correlation between intrinsic glutamate and implicit memory task performance in the right IFG. Patients: red; controls: blue. (B) PEB findings in the recognition task. Top left: group differences in subcortical input into the left occipital gyrus between patients and controls, showing mean ± SEM of parameter estimates across participants. Centre left: group differences in forward connectivity strengths from the left ITG to left IFG between patients and controls, showing mean ± SEM of parameter estimates across participants. Centre right: no significant correlation between forward connectivity strengths from the left ITG to left IFG, and ACE scores in patients only (rho = 0.0039, P = 0.987, Spearman’s rank correlation). Bottom right: correlation between backward connectivity strengths from the right ITG to right OCP, and explicit memory task performance. Patients: red; controls: blue. AD = Alzheimer’s disease; corr. = correlation; SEM = standard error of mean.

