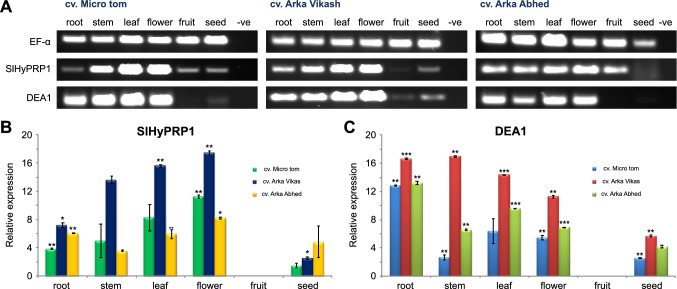
Fig. 2.
Expression analysis of SlHyPRP1 and DEA1 genes in different tissues of three tomato (S. lycopersicum) cultivars through semi-quantitative PCR and qRT-PCR. A. Semi-quantitative PCR analysis of SlHyPRP1 and DEA1. B and C. qRT-PCR analysis of SlHyPRP1 and DEA1. Values were normalized to Ef-1α as house-keeping gene and are calculated relative to that in fruit. The significant difference in expression level of SlHyPRP1 and DEA1 were evaluated by student’s t-test within each cultivar, taking each tissue separately with respect to the tissue having least expression. The bar represents mean ± SE from three technical replicates (*P < 0.05, **P < 0.01, ***P < 0.001)

