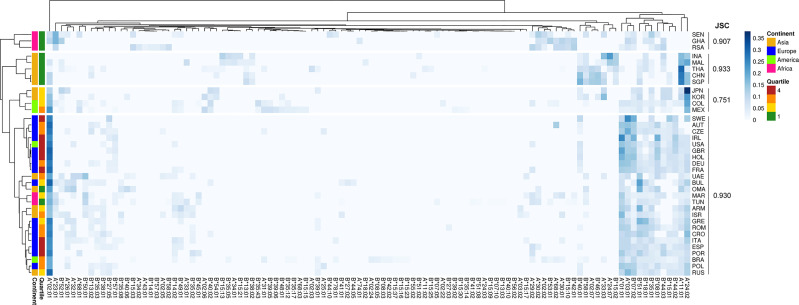
Figure 1.
Unsupervised two-dimensional cluster analysis of 37 countries by HLA-A and HLA-B Allele frequencies. Each row represents a population, the first column represents the deaths per million inhabitants quartiles: Q1 = green (lower than 5); Q2 = yellow (5 to 20); Q3 = orange (21 to 85); Q4 = red (greater than 85). The other columns represent HLA alleles, which frequencies values are represented by the blue scale color bar. The complete method and 1-Pearson correlation coefficient as distance were used to cluster rows and columns.

