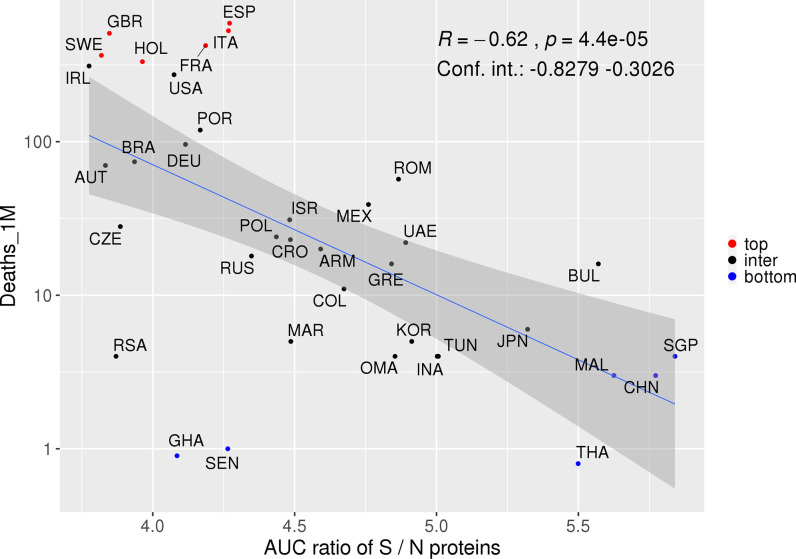
Figure 6.
Proteins S and N potentially associated with opposite responses associated with COVID-19. Spearman correlation between the S/N AUC ratio and deaths per million inhabitants. Colors represent countries with a higher (red) or lower (blue) number of deaths. The confidence interval shown was calculated using bootstrap with 1,000 replacements.

