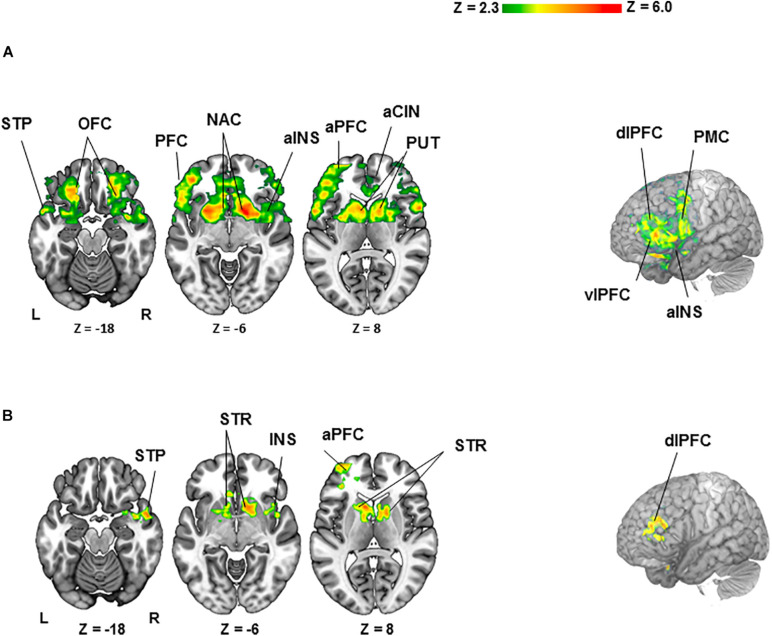
FIGURE 2.
Clusters of activation (colored) obtained from voxelwise contrasts of the bad- minus good spinner zero (BZ-GZ) projected onto a background (grayscale) representing participants’ mean high-resolution anatomic image (z > 2.3, with a cluster-defining threshold of p = 0.05 and corrected for multiple comparisons). Coordinates are in accordance with the Montreal Neurological Institute (MNI) space. (A) For healthy participants (n = 27), significant activation was detected in frontal-, temporal-, and insular cortices and striatal regions. (B) For healthy (n = 27) > PTSD (n = 20) contrast, significant activation was detected in frontal-, temporal-, and insular cortices and striatal regions. Terms of location: a, anterior; dl, dorsolateral; vl, ventrolateral. Cortical: CIN, cingulate; INS, insula; OFC, orbitofrontal cortex; PFC, prefrontal cortex; PMC, premotor cortex; STP, superior temporal lobe. Subcortical: NAC, nucleus accumbens; PUT, putamen; STR, striatum (caudate, pallidum and putamen).

