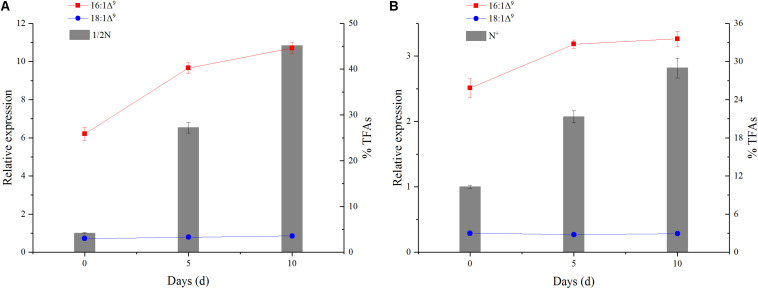
FIGURE 3.
The correlation of the expression of PtAAD with molar percentage of C16:1Δ9 and C18:1Δ9 under nitrogen-depleted condition (A) and normal culturation condition (B). Columns show percentage of total fatty acid composition and line for relative expression of PtAAD. Three biological replicates were analyzed in each tissue.

