FIGURE 5.
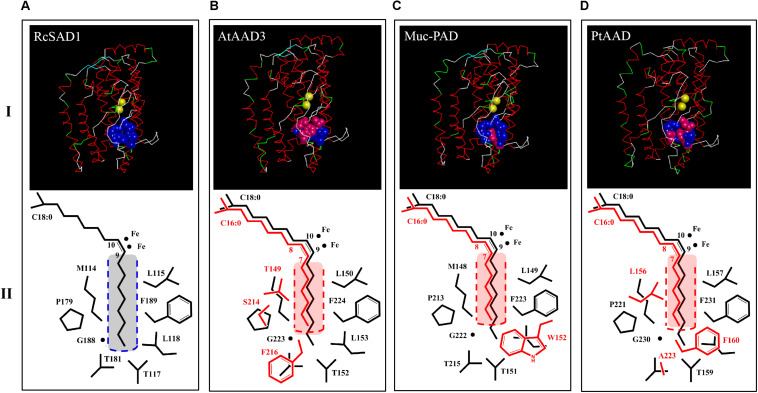
3D structure models of PtAAD protein monomer [(D), upper panel I] and C18:0/C16:0-ACP chains as well as side chains of key amino acids close to catalytic center of diiron ions (II lower panel). All 3D models were predicted on Swiss-model (https://swissmodel.expasy.org/) with RcSAD1 (NP_001310659.1) and AtAAD3 as temple (A,B). RcSAD1 (NP_001310659), AtAAD3 (At5g16230) and Muc-PAD (AFV61670.1) as templates (A–C) File of 3D structure of PtSAD is shown in Discovery Studio 4.1 software. Blue bolls/spheres in the upper panel represent common amino acids that were the same as RcSAD1 while pink bolls show the varied amino acids. The fatty-acyl chains and side chains of amino acids were drawn by ChemDraw software (II panel). Black color represents C18:0-ACP and its amino acids. Red indicates C16:0-ACP and varied amino acids and yellow bolls for diiron ions. Black and red dashed boxes stand for substrate binding cavity (or channel) of 18:0-ACP and C16:0-ACP, respectively (II panel).

