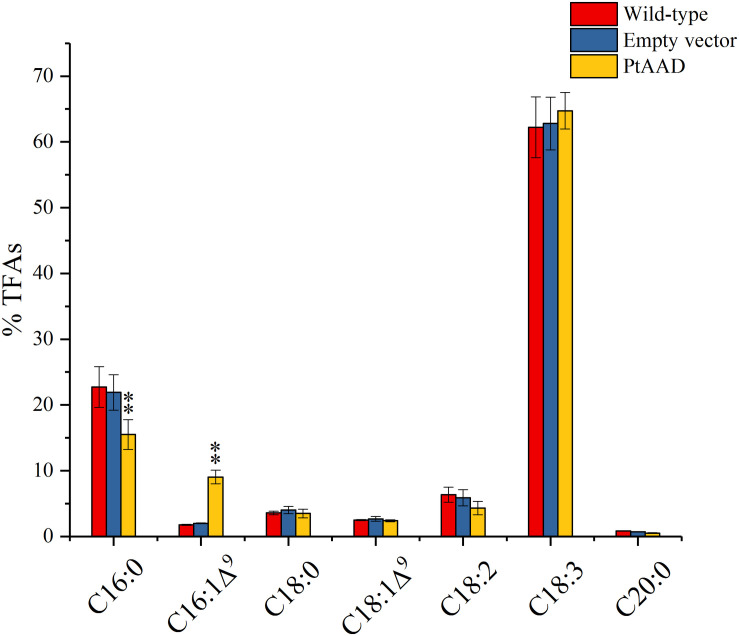
FIGURE 6.
Fatty acid composition in N. benthamiana leaves transiently expressing PtAAD gene. Fatty acids were analyzed by GC and the data are means of mol% ± SE with three independent replicates. “*” and “**” indicate p < 0.05 and p < 0.01, respectively. Empty vector of pCAMBIA1303 was used as negative control. Data are shown as mean ± SE (n = 3).

