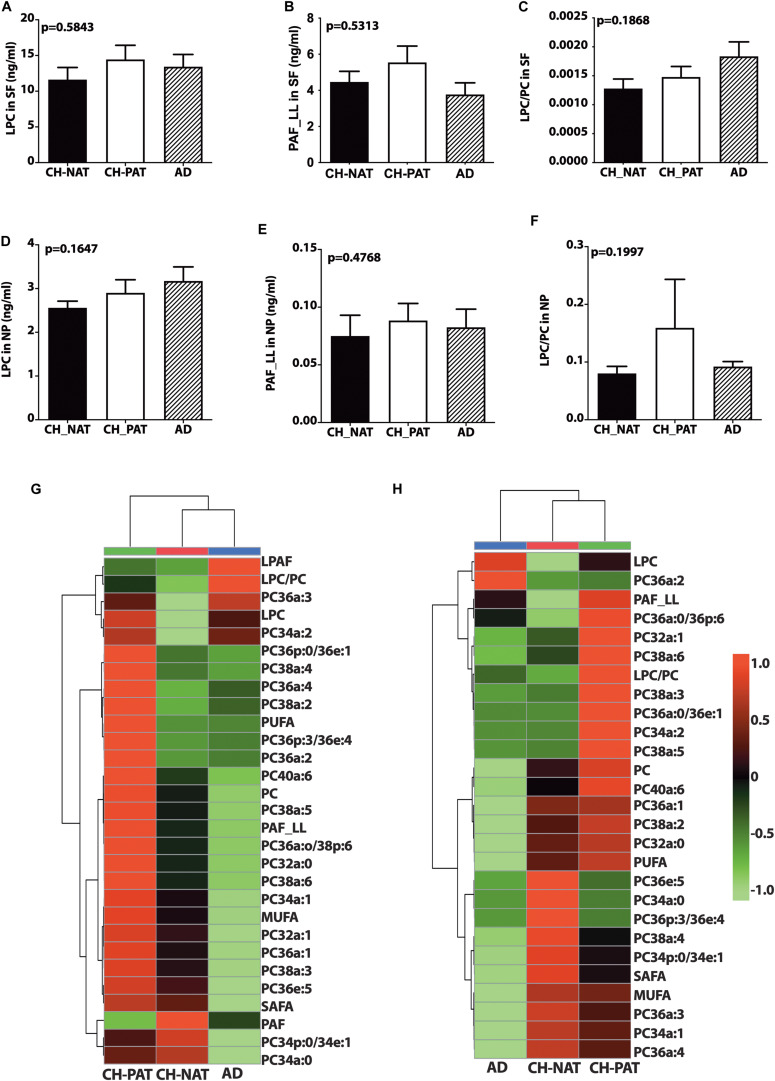
FIGURE 2.
Phosphocholine glycerophospholipids and hierarchical clustering of all phosphatidylcholine (PC) glycerophospholipids in the supernatant fluids (SF) and nanoparticles (NP) fractions – Levels of lysophosphatidylcholine (LPC; A), PAF_LL (B), and the LPC to PC (C) ratios were determined in the SF fraction of CH-NAT, CH-PAT, and AD. LPC (D), and PAF_LL (E) and the LPC/PC ratio (F) were similarly determined in the NP fractions. Group comparisons were made using One way ANOVA (Kruskal–Wallis test) combined with Dunn’s multiple comparisons. The p-values are from One way ANOVA, while significant changes (p < 0.05) from Dunn’s are indicated with an asterisk (*). The heatmap displays the hierarchical clustering of PC-glycerophospholipids in the SF fraction (G) and the NP fraction (H). Distance measures of the heatmap use Euclidean while the clustering algorithm uses Ward on the Metabanalyst 4.0 platform.

