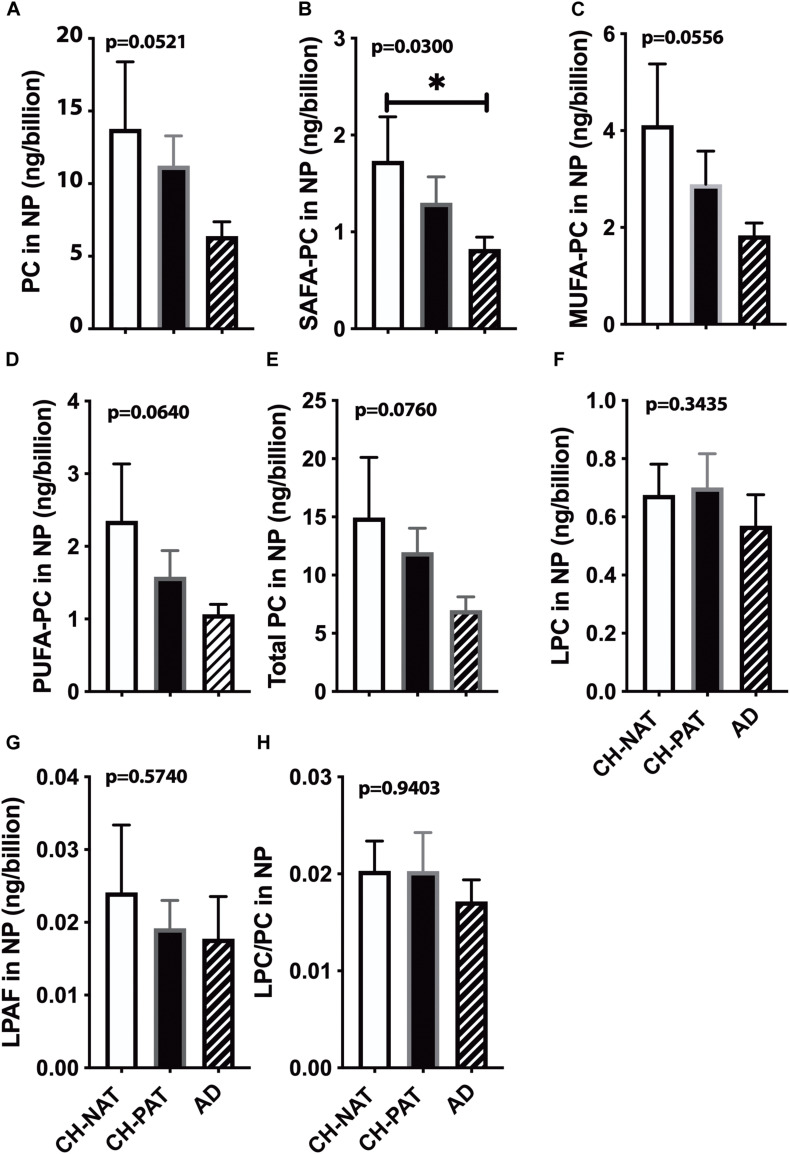
FIGURE 3.
Phosphatidylcholine (PC) levels normalized to the nanoparticles (NP) concentration in cerebrospinal fluid (CSF) – The levels of PC (A), SAFA-containing PC (B), MUFA-containing PC species (C), PUFA-containing PC species (D), LPC (E), LPAF (F), total PC lipids (G), and the LPC to PC ratio (H) were normalized to the number of NPs (billions) in CSF. These data are the mean ± SEM, and group comparisons were made using One way ANOVA (Kruskal–Wallis test) combined with Dunn’s multiple comparisons. The p-values are derived from One way ANOVA, and significant changes (p < 0.05) from Dunn’s are indicated with an asterisk (*).

