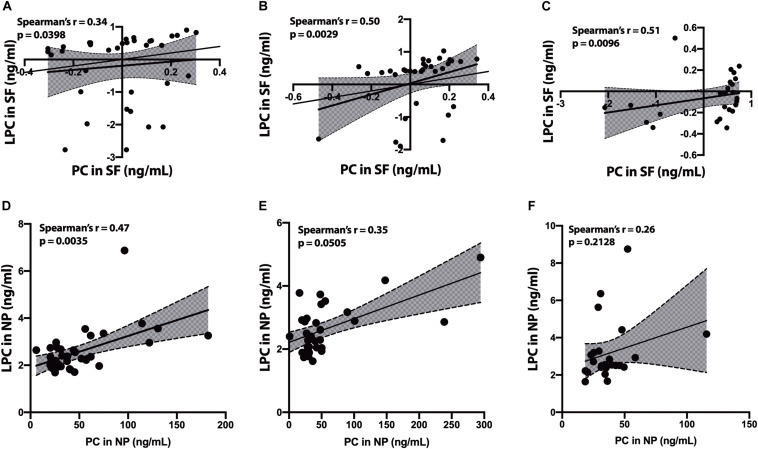
FIGURE 4.
Correlation of PC to lysophosphatidylcholine (LPC) in cerebrospinal fluid (CSF) fractions – We performed Spearman’s correlation of PC to LPC in the SF fraction for CH-NAT (A), CH-PAT (B), and AD (C). Similarly, we performed a correlation of PC to LPC in the nanoparticles (NP) fraction for CH-NAT (D), CH-PAT (E), and AD (F). The data for the SF fractions was log 10 transformed to enable us to plot all the data on the same scale while the unnormalized data is shown for the NP correlation analyses. Spearman’s rho (r) and the p-values are indicated for each correlation analysis.

