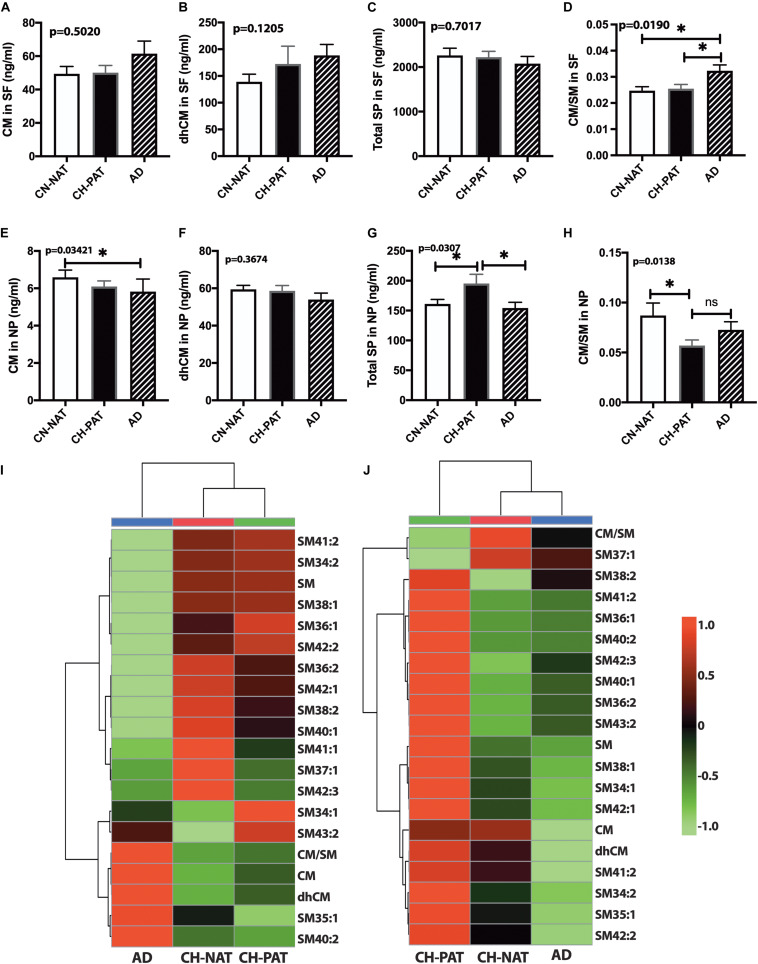
FIGURE 7.
Alteration in cerebrospinal fluid (CSF) sphingolipids (SPs) in the CH-PAT group – SP levels in the supernatant fluids (SF) and nanoparticles (NP) fractions were determined for CH-NAT, CH-PAT, and AD samples. CM (A), dhCM (B), total SP in the SF fraction (C), and the CM/SM ratio (D) were determined in the SF fraction. In the NP fraction, we also quantified CM (E), dhCM (F), total SP (G), and the ratio of CM to SM (H). These data are the mean ± SEM and a significant change (p < 0.05) in SP amounts way ANOVA and Dunns multiple comparisons) are indicated with a symbol (*). The heatmaps show the clustering data of SP changes in the SF fraction (I) and the NP fraction (J). The distance measures used Euclidean while the clustering algorithm used Ward on the Metabanalyst 4.0 platform.

