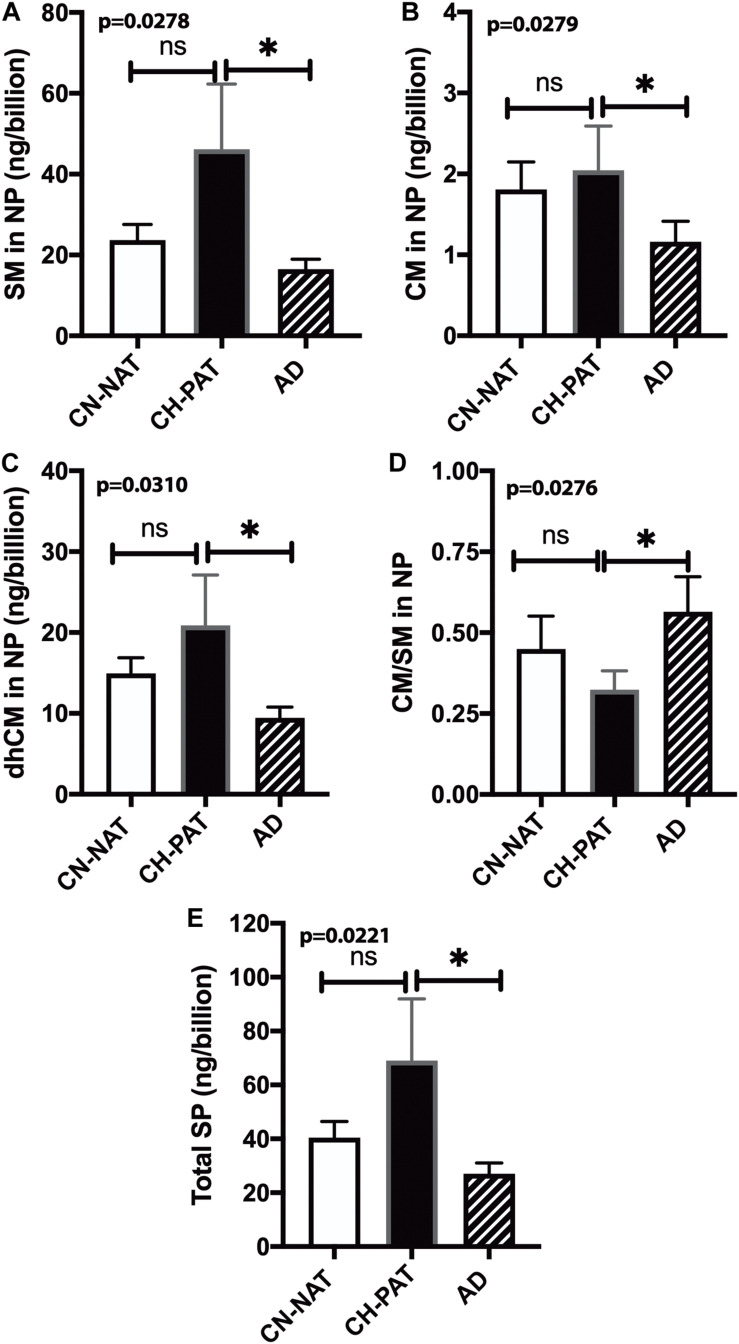
FIGURE 8.
Sphingomyelin levels normalized to the nanoparticles (NP) concentration in cerebrospinal fluid (CSF) – The levels of SM (A), CM (B), dhCM (C), CM/SM ratio (D), and total SP (E) in the NP fraction were normalized to the number of NPs (billions) in CSF. These data are the mean ± SEM, and group comparisons were made using One way ANOVA (p-values) combined with Dunn’s multiple comparisons (asterisks). Significant changes (p < 0.05) are indicated with an asterisk (*).

