Figure 3.
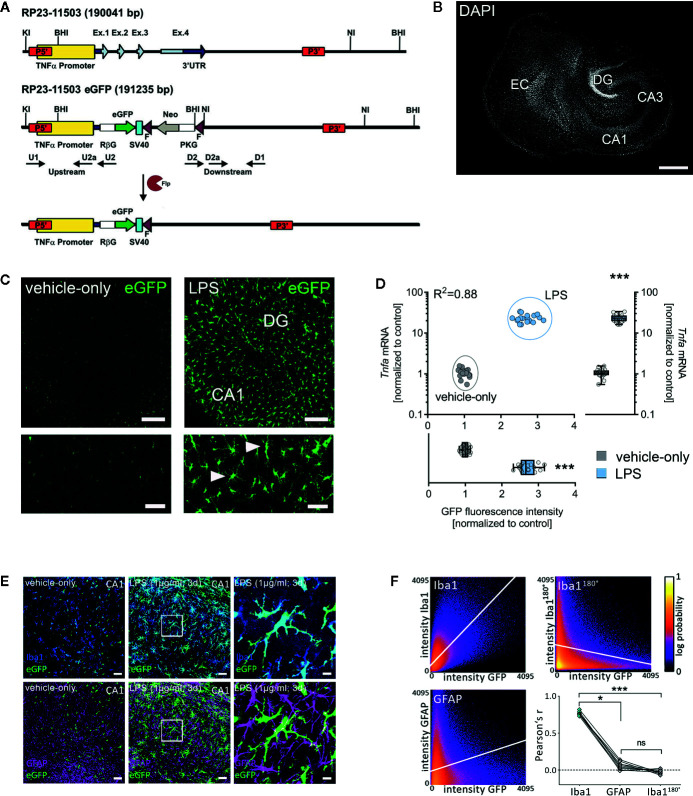
Microglia are a major source of tumor necrosis factor α (TNFα) in tissue cultures exposed to Lipopolysaccharide. (A, B) Schematic representation of the Tg(TNFa-eGFP) reporter transgenic construct. The Tnfa locus of BAC RP23-115O3 containing the Tnfa promoter as well as the four exons (Ex. 1 to 4) are shown in the upper part. In the recombinant eGFP BAC (middle part), the Tnfa coding sequence and the 3’ untranslated region (3’UTR) were replaced by eGFP and neomycin (Neo) coding cassettes. After flippase (Flp) mediated intra-chromosomal recombination, the neo cassette is excised, leaving the Rabbit β-globin intron (RβG)-eGFP fusion gene under the control of the Tnfa promoter, as illustrated in the lower part. SV40, SV40 early mRNA polyadenylation; F, flippase recognition target; PKG, phosphoglycerate kinase. A tissue culture stained with DAPI nuclear staining is shown to visualize cytoarchitecture. Scale bar: 400 µm. (C) Examples of tissue cultures prepared from C57BL/6-Tg(TNFa-eGFP) mice after 3 days (3 d) of treatment with 1 µg/ml LPS (right side) and vehicle-only (left side). A considerable increase in the eGFP signal is observed in the LPS-treated group (smaller sections with higher magnification at the bottom). Scale bars: row at the top 200 µm and row at the bottom 75 µm. (D) Quantification of the eGFP signal and the corresponding Tnfa-mRNA content of individual cultures in vehicle-only (gray dots) and LPS-treated (blue dots) C57BL/6-Tg(TNFa-eGFP) organotypic tissue cultures (n = 18 cultures per group and experimental condition; Mann-Whitney test, UGFP-intensity = 0, UTnfa -mRNA = 0; Boxplot diagrams indicate the level of significance and distribution of data points within the groups; R² was calculated by linear regression analysis). (E) Examples of C57BL/6-Tg(TNFa-eGFP) tissue cultures treated with vehicle-only or LPS stained for the astrocytic marker GFAP and the microglial marker Iba1. Scale bars: left and middle row 50 µm and right row 10 µm. (F) Quantitative assessment of colocalization shows colocalization between the GFP- and the Iba1-signal, but not the GFP- and the GFAP-signal. The same set of images in which the Iba1-signal is rotated 180° served as a control for this analysis (n = 9 cultures per group; Kruskal-Wallis test followed by Dunn’s multiple comparisons). Individual data points are indicated by single dots. Values represent mean ± s.e.m. (* p < 0.05, *** p < 0.001; ns, not significant difference).

