Figure 4.
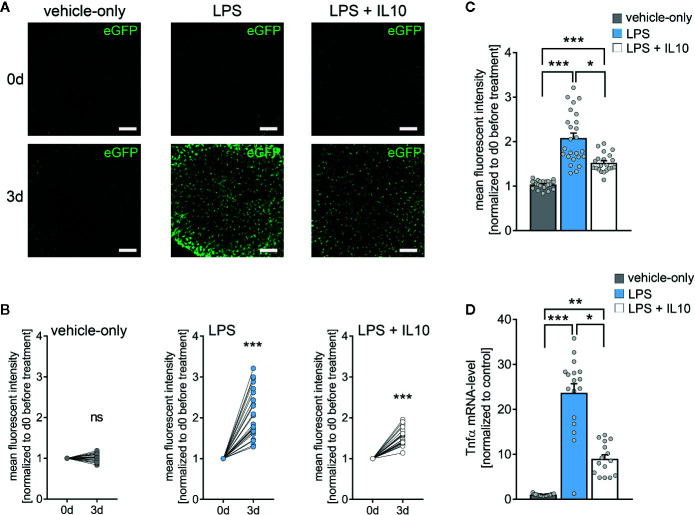
Interleukin 10 (IL10) attenuates in vitro LPS-induced TNFα expression. (A) Examples of time-lapse imaging of C57BL/6-Tg(TNFa-eGFP) tissue cultures before treatment (0 d, row at the top) and 3 days after treatment with vehicle-only, LPS (1 µg/ml) or LPS (1µg/ml) + IL10 (10 ng/ml), respectively (3 d, row at the bottom). Scale bars: 200 µm. (B, C) Group data of eGFP fluorescence intensities before the treatment (0 d) and after 3 days in the respective groups (nvehicle-only = 24, nLPS = 25, nLPS+IL10 = 21 cultures per group; Wilcoxon matched-pairs signed rank test, B). IL10 restrains LPS-induced microglial TNFα expression (Kruskal-Wallis test followed by Dunn’s multiple comparisons, C). (D) Changes in eGFP fluorescence intensity correspond to Tnfa-mRNA levels in the respective groups (nvehicle-only = 17, nLPS = 17, nLPS+IL10 = 15 cultures per group; Kruskal-Wallis test followed by Dunn’s multiple comparisons test). Individual data points are indicated by colored dots. Values represent mean ± s.e.m. (* p < 0.05, ** p < 0.01, *** p < 0.001; ns, not significant difference).

