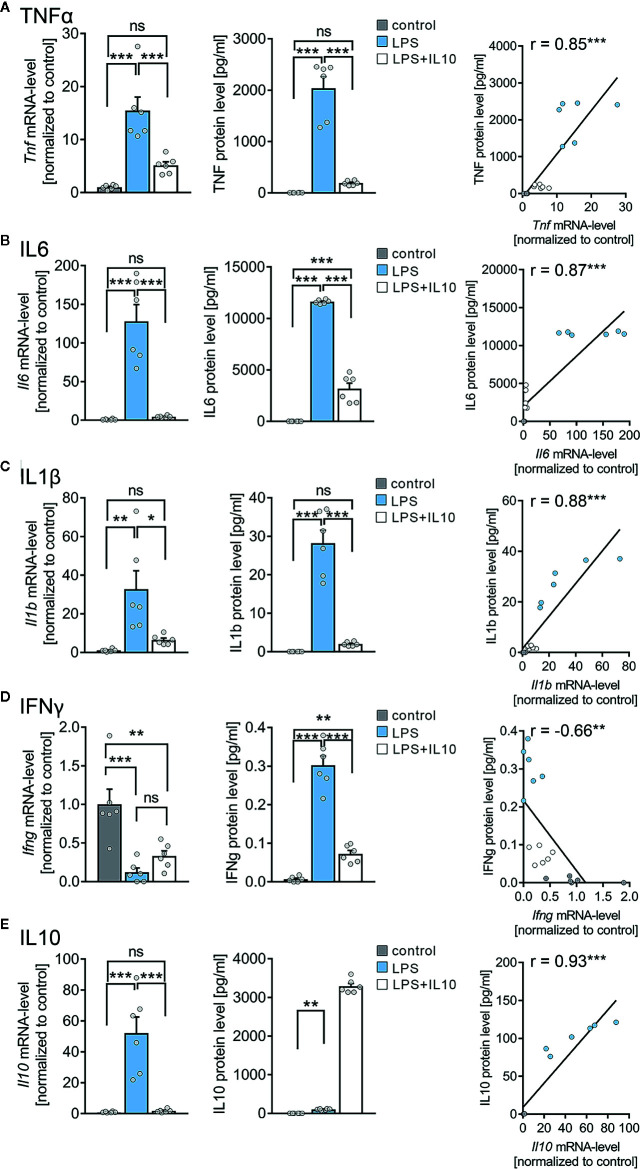
Figure 5.
Expression profiles of cytokines in entorhino-hippocampal tissue cultures exposed to Lipopolysaccharide and interleukin 10 (IL10). (A–D) Group data and correlations of mRNA and protein levels in the incubation medium of (A) tumor necrosis factor α (TNFα), (B) interleukin 6 (IL6), (C) interleukin 1β (IL1β), and (D) interferon γ (IFNγ) in vehicle-only, LPS (1 µg/ml, 3 days) or LPS (1 µg/ml, 3 days) + IL10 (10 ng/ml, 3 days) treated cultures, respectively (n = 6 culture samples or culturing medium respectively for each experimental condition; one-way ANOVA followed by Holm-Sidak’s multiple comparison test; linear regression fit indicated by black line; Pearson’s r indicated in the figure panels). (E) Group data of mRNA and protein levels of IL10 in the respective groups (n = 6 culture samples or culturing medium respectively for each experimental condition; one-way ANOVA followed by Holm-Sidak’s multiple comparison test, Mann-Whitney test for statistical comparison of IL10 levels (U = 0); linear regression fit indicated by black line; values for IL10 protein level in the LPS + IL10-treated group were excluded from the fitting procedure; Pearson’s r indicated in the figure panels). Individual data points are indicated by colored dots. Values represent mean ± s.e.m. (* p < 0.05, ** p < 0.01, *** p < 0.001; ns, not significant difference). U values are provided for significant results only.

