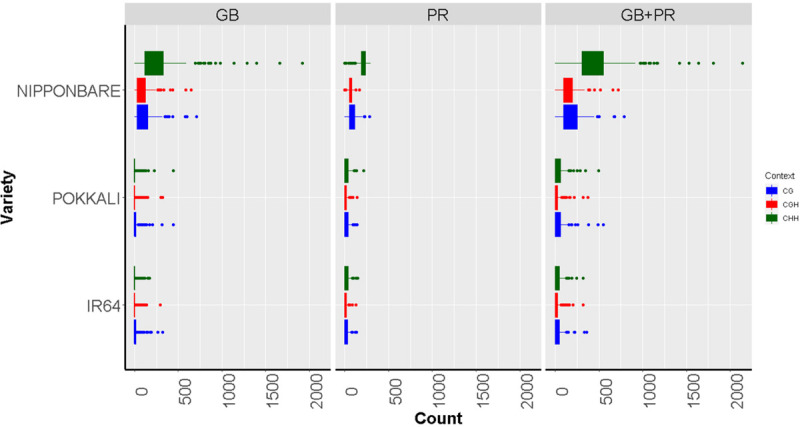
FIGURE 3.

Boxplots showing methylated cytosine frequency in three sequence contexts: CG (blue), CHG (red), and CHH (green) among three different rice varieties with contrast responses to aluminum exposure: Nipponbare (Tolerant), Pokkali, and IR64 (Susceptible). The results are discriminated according to the location of the epigenetic mark, either inside the gene body region (GB), the promoter (PR), or both the promoter and inside the gene body region of analyzed genes (PR + GB).
