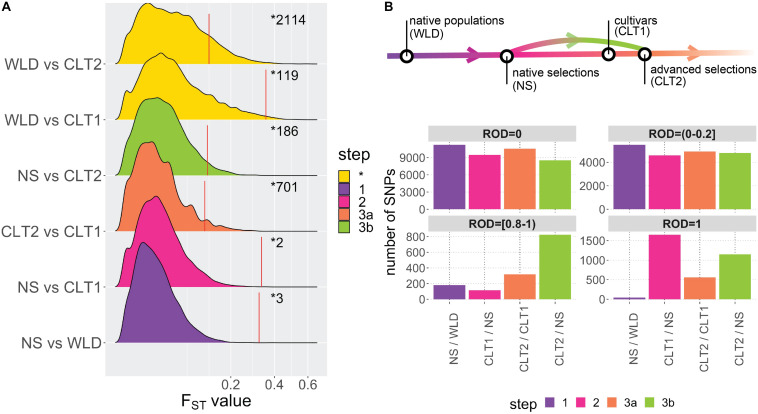
FIGURE 3.
Impact of domestication and breeding on cranberry (Vaccinium macrocarpon Ait.) genetic diversity. (A) Density plots for FST values among all subgroup combinations. Colors are based on meaningful subgroup comparisons in the context of the cranberry domestication/breeding history (step 1 in red, step 2 in green, step 3a in blue, and step 3b in purple; non-categorized comparisons are displayed in yellow and as step *). Red vertical lines correspond to FST 95th percentiles (significant thresholds) obtained from permutation analysis on each subgroup comparison; numbers after the red line correspond to the number of significant FST values on each subgroup comparison. (B) Genomic regions with different levels of reduction of diversity (ROD = 0, ROD >0 and ≤0.2, ROD ≥0.8 and <1, and ROD = 1), organized according with A.

