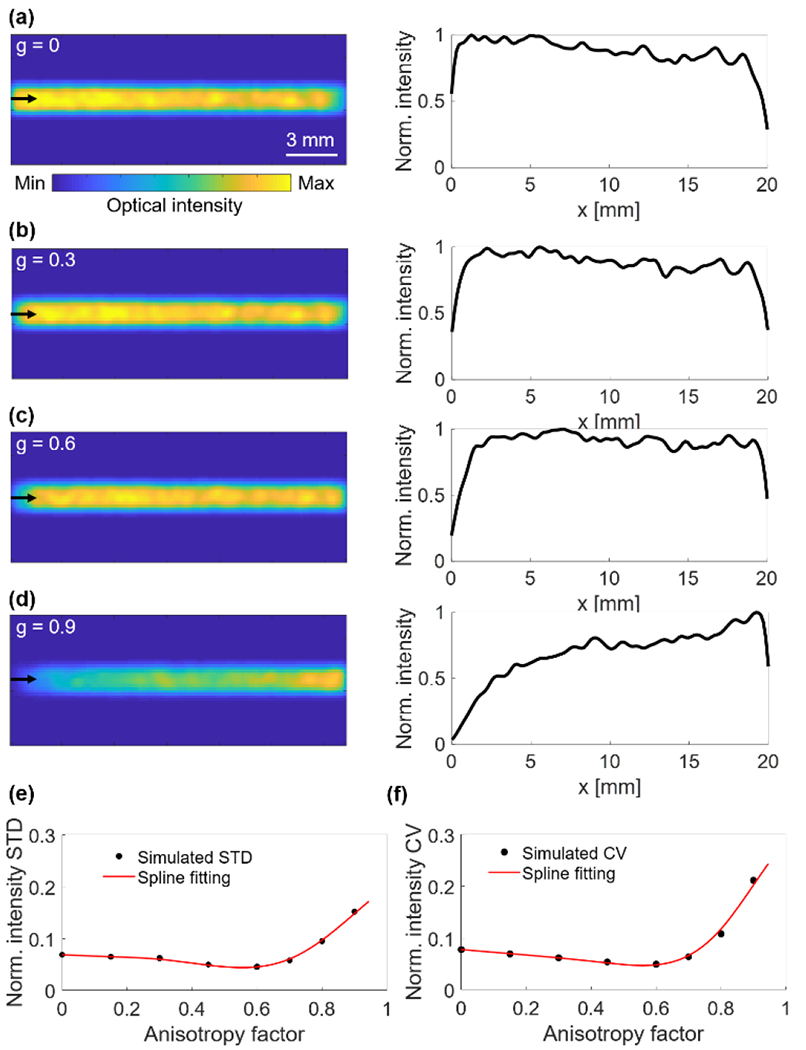
Fig. 3.

Simulated light emission distributions and profiles along the diffuser with scattering anisotropy factors of (a) 0, (b) 0.3, (c) 0.6, and (d) 0.9. (e) The STD of normalized optical intensity along the fiber diffuser with different anisotropy factors. (f) The CV of normalized optical intensity along the fiber diffuser with different anisotropy factors. Black dots represent the simulated values and red lines represent the spline fitting.
