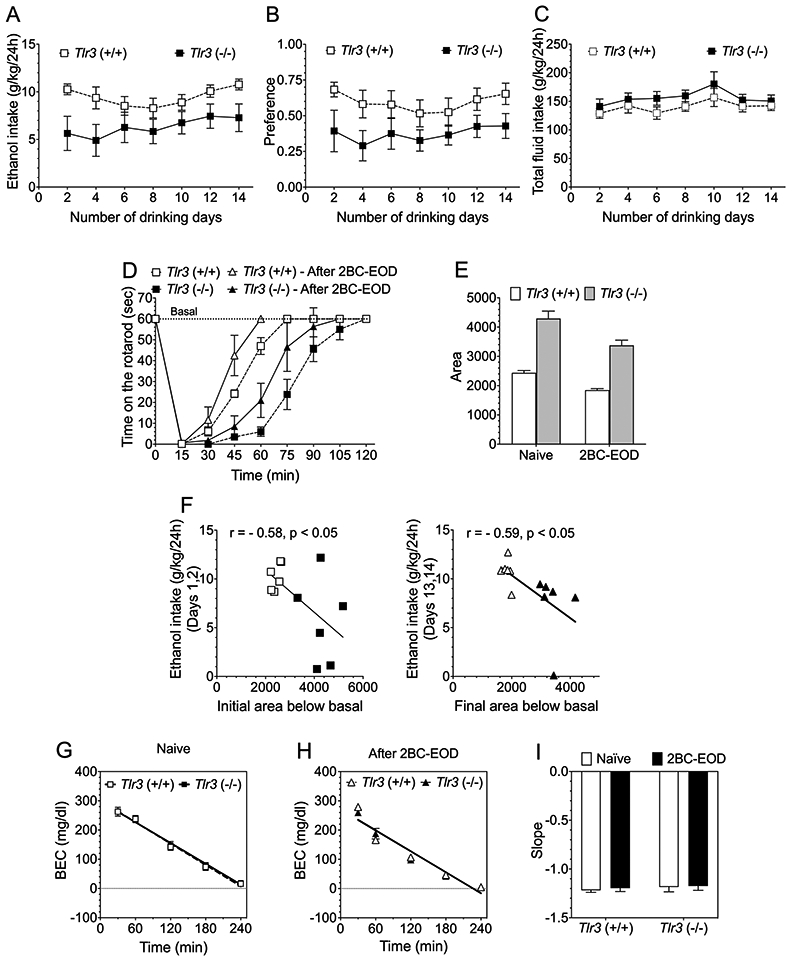
Figure 11.

Inverse relationship between levels of two-bottle choice-every-other-day (2BC-EOD) ethanol consumption and recovery time from ataxia in Tlr3 −/− and Tlr3 +/+ male mice. Ethanol-induced rotarod ataxia and then blood ethanol clearance were measured on consecutive days before and beginning 24 hours after the 2BC-EOD drinking procedure. (A) Ethanol (15% v/v) consumption (g/kg/24 hours), (B) ethanol preference, and (C) total fluid intake (g/kg/24 hours) in wild-type and Tlr3 −/− male mice (n = 6 per genotype). Each data point represents the average of two drinking days (measured with two different bottle positions). (D) Time on the rotarod after ethanol (2 g/kg, i.p.) in wild-type and Tlr3 −/− ethanol-naïve and 2BC-EOD exposed male mice (n = 6 per group). (E) Areas below the basal level and above the recovery curves after ethanol injection. (F, left panel) Correlation between initial ethanol intake (g/kg/24h) on drinking days 1 and 2 (A) and initial area below basal (E) from individual mice from both genotypes (open symbols represent Tlr3 +/+ and filled symbols represent Tlr3 −/− male mice; n = 6 per genotype). (F, right panel) Correlation between final levels of ethanol intake (g/kg/24h) on drinking days 13 and 14 (A) and final area below basal (E) from individual mice from both genotypes (open symbols represent Tlr3 +/+ and filled symbols represent Tlr3 −/− male mice; n = 6 per genotype). Blood ethanol concentrations (BEC) after 2 g/kg ethanol (i.p.) in (G) ethanol-naïve (n = 4 per genotype) and (H) 2BC-EOD exposed (n = 6 per genotype) mice. (I) Slopes of the regression curves in these mice (n = 4-6 per genotype).
