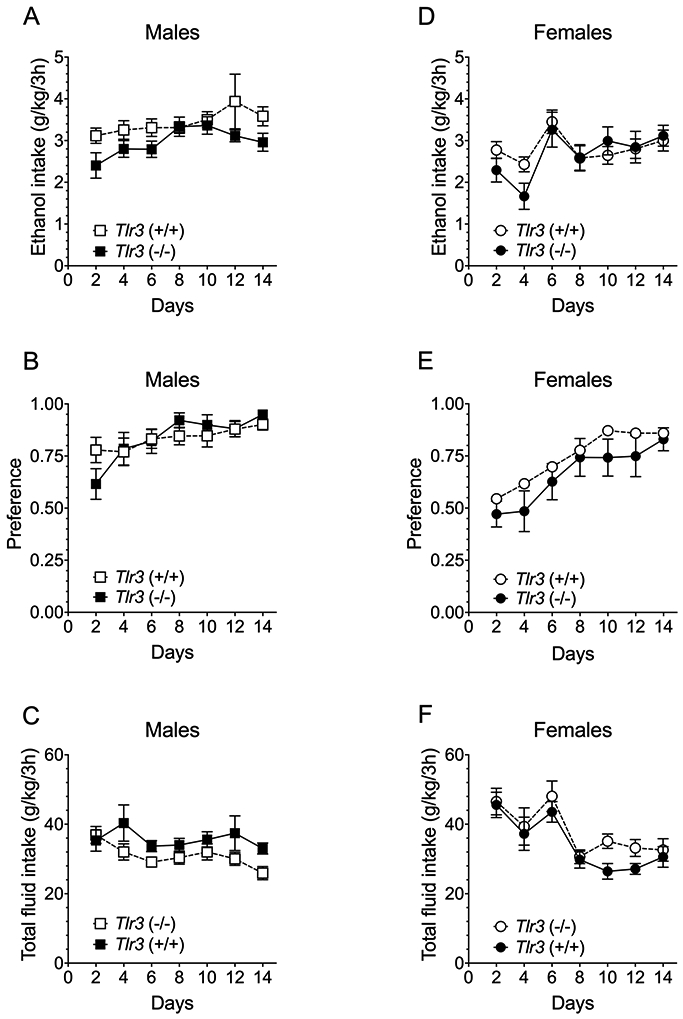
Figure 3.

Tlr3 −/− and Tlr3 +/+ mice show similar ethanol intake in the 2BC limited-access procedure. (A,D) Ethanol (15% v/v) consumption (g/kg/3 hours), (B,E) Preference for ethanol, and (C,F) Total fluid intake (g/kg/3 hours) in male (n = 10 per genotype) and female (n = 10 per genotype) mice. Each data point represents the average of two drinking days (measured with two different bottle positions).
