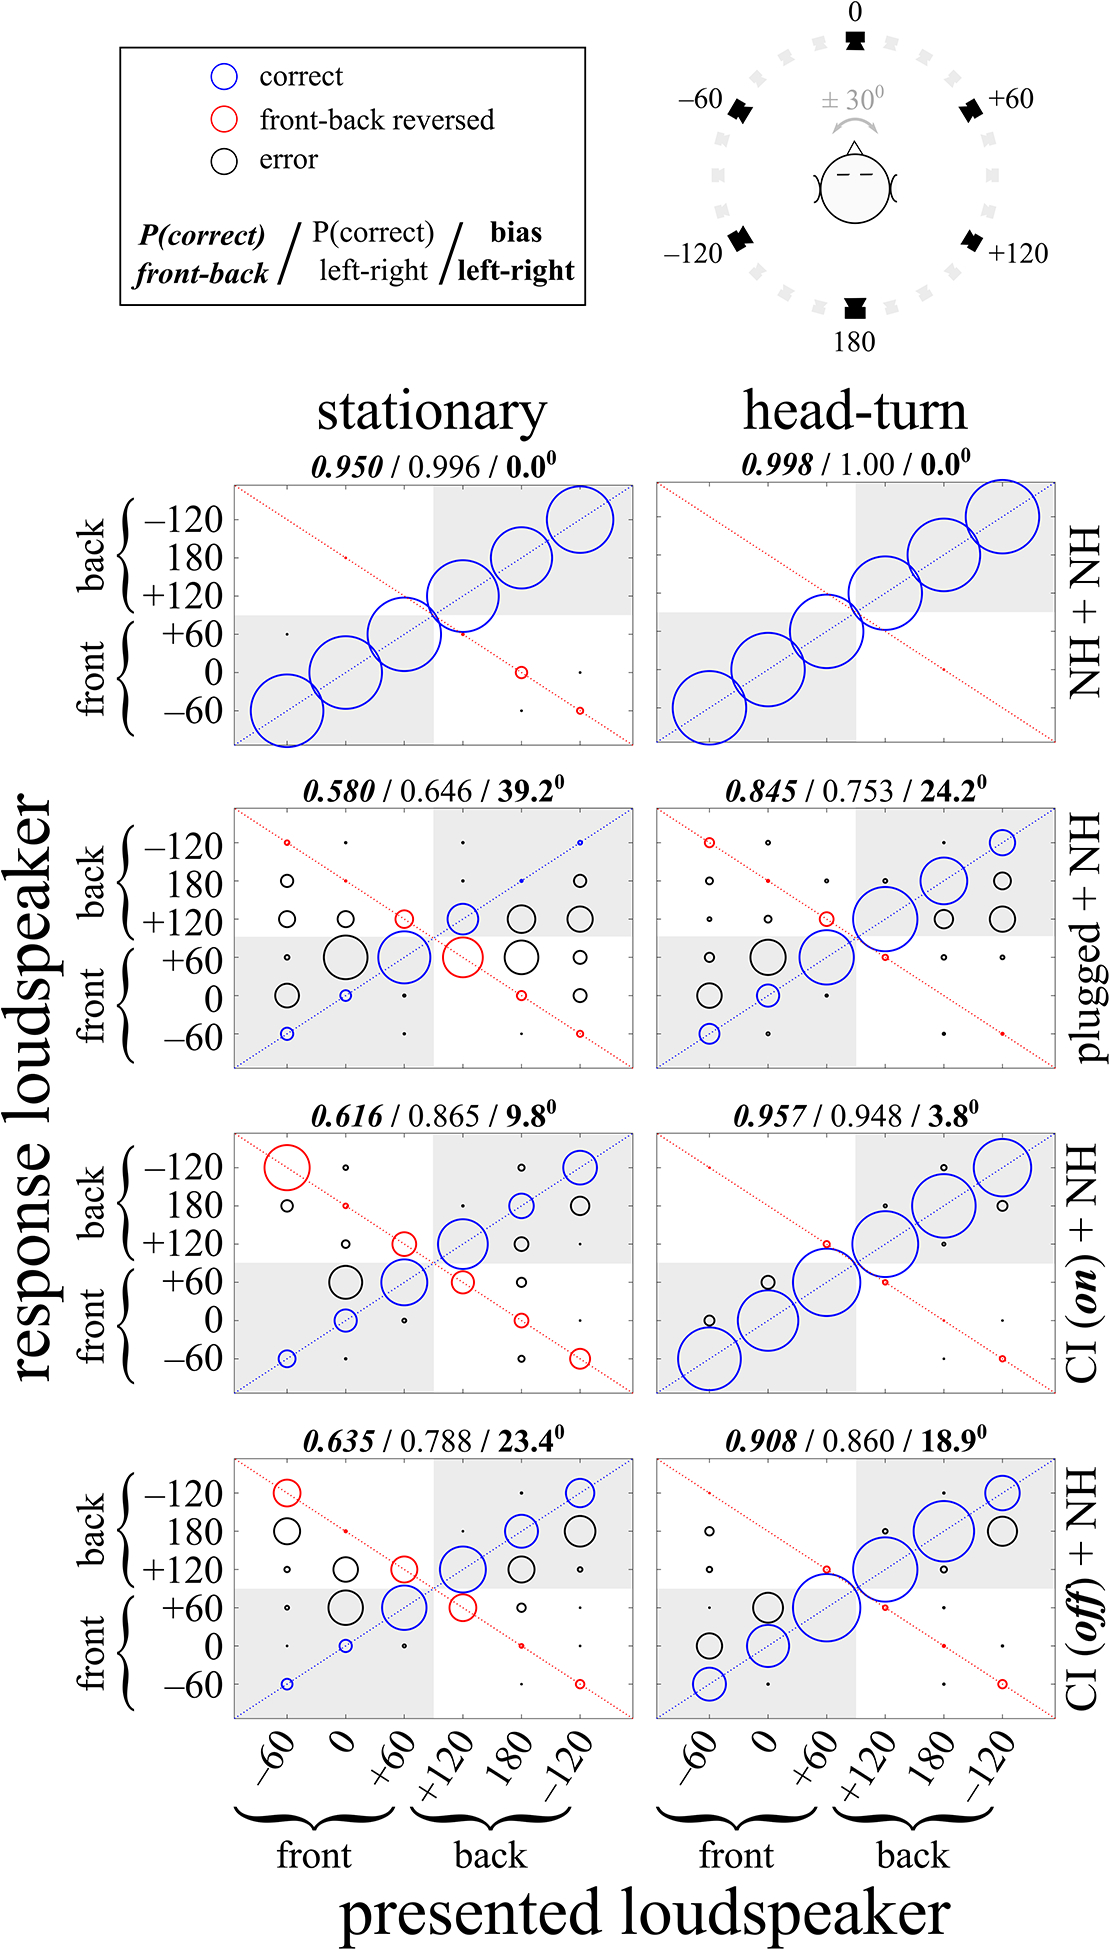
Fig. 2.

Group data, pooled across listeners. See Fig. 7 for individual data. The horizontal axis shows the loudspeaker positions (in degrees) from which stimuli were presented, and the vertical axis shows the loudspeaker positions (also in degrees) listeners identified in response to the stimulus presentations. The radius of each circle is proportional to the number of responses at that location. Correct responses, indicated with blue circles, are along the positive diagonal. Front-back reversed responses, indicated with red circles, are along the negative diagonal. All other errors are represented with black circles. Responses to the correct front-back hemifield are located in the shaded areas of each figure panel. The left column shows data for the stationary head condition and the right column shows data for when listeners turned their heads. The top 2 rows show data for NH listeners with either both ears unblocked (NH + NH) or with one ear acutely plugged (plugged + NH). Note that the 2 groups of NH listeners are not the same, and that seven of the eight NH + NH bilateral listeners’ data were previously included in Pastore (2018). The bottom 2 rows show data for SSD-CI listeners with cochlear implants either on (CI(on) + NH) or off (CI(off) + NH). Above each figure panel, from left-to-right, are the proportion of responses in the correct front-back hemifield (bold italic font), the proportion of responses in the correct left-right hemifield (normal font), and the mean bias toward the NH ear in degrees (bold font). All figures are plotted so the unoccluded NH ear is on the right side (positive degrees) and the occluded ear or implanted ear is on the left (negative degrees). See Methods section for further details.
