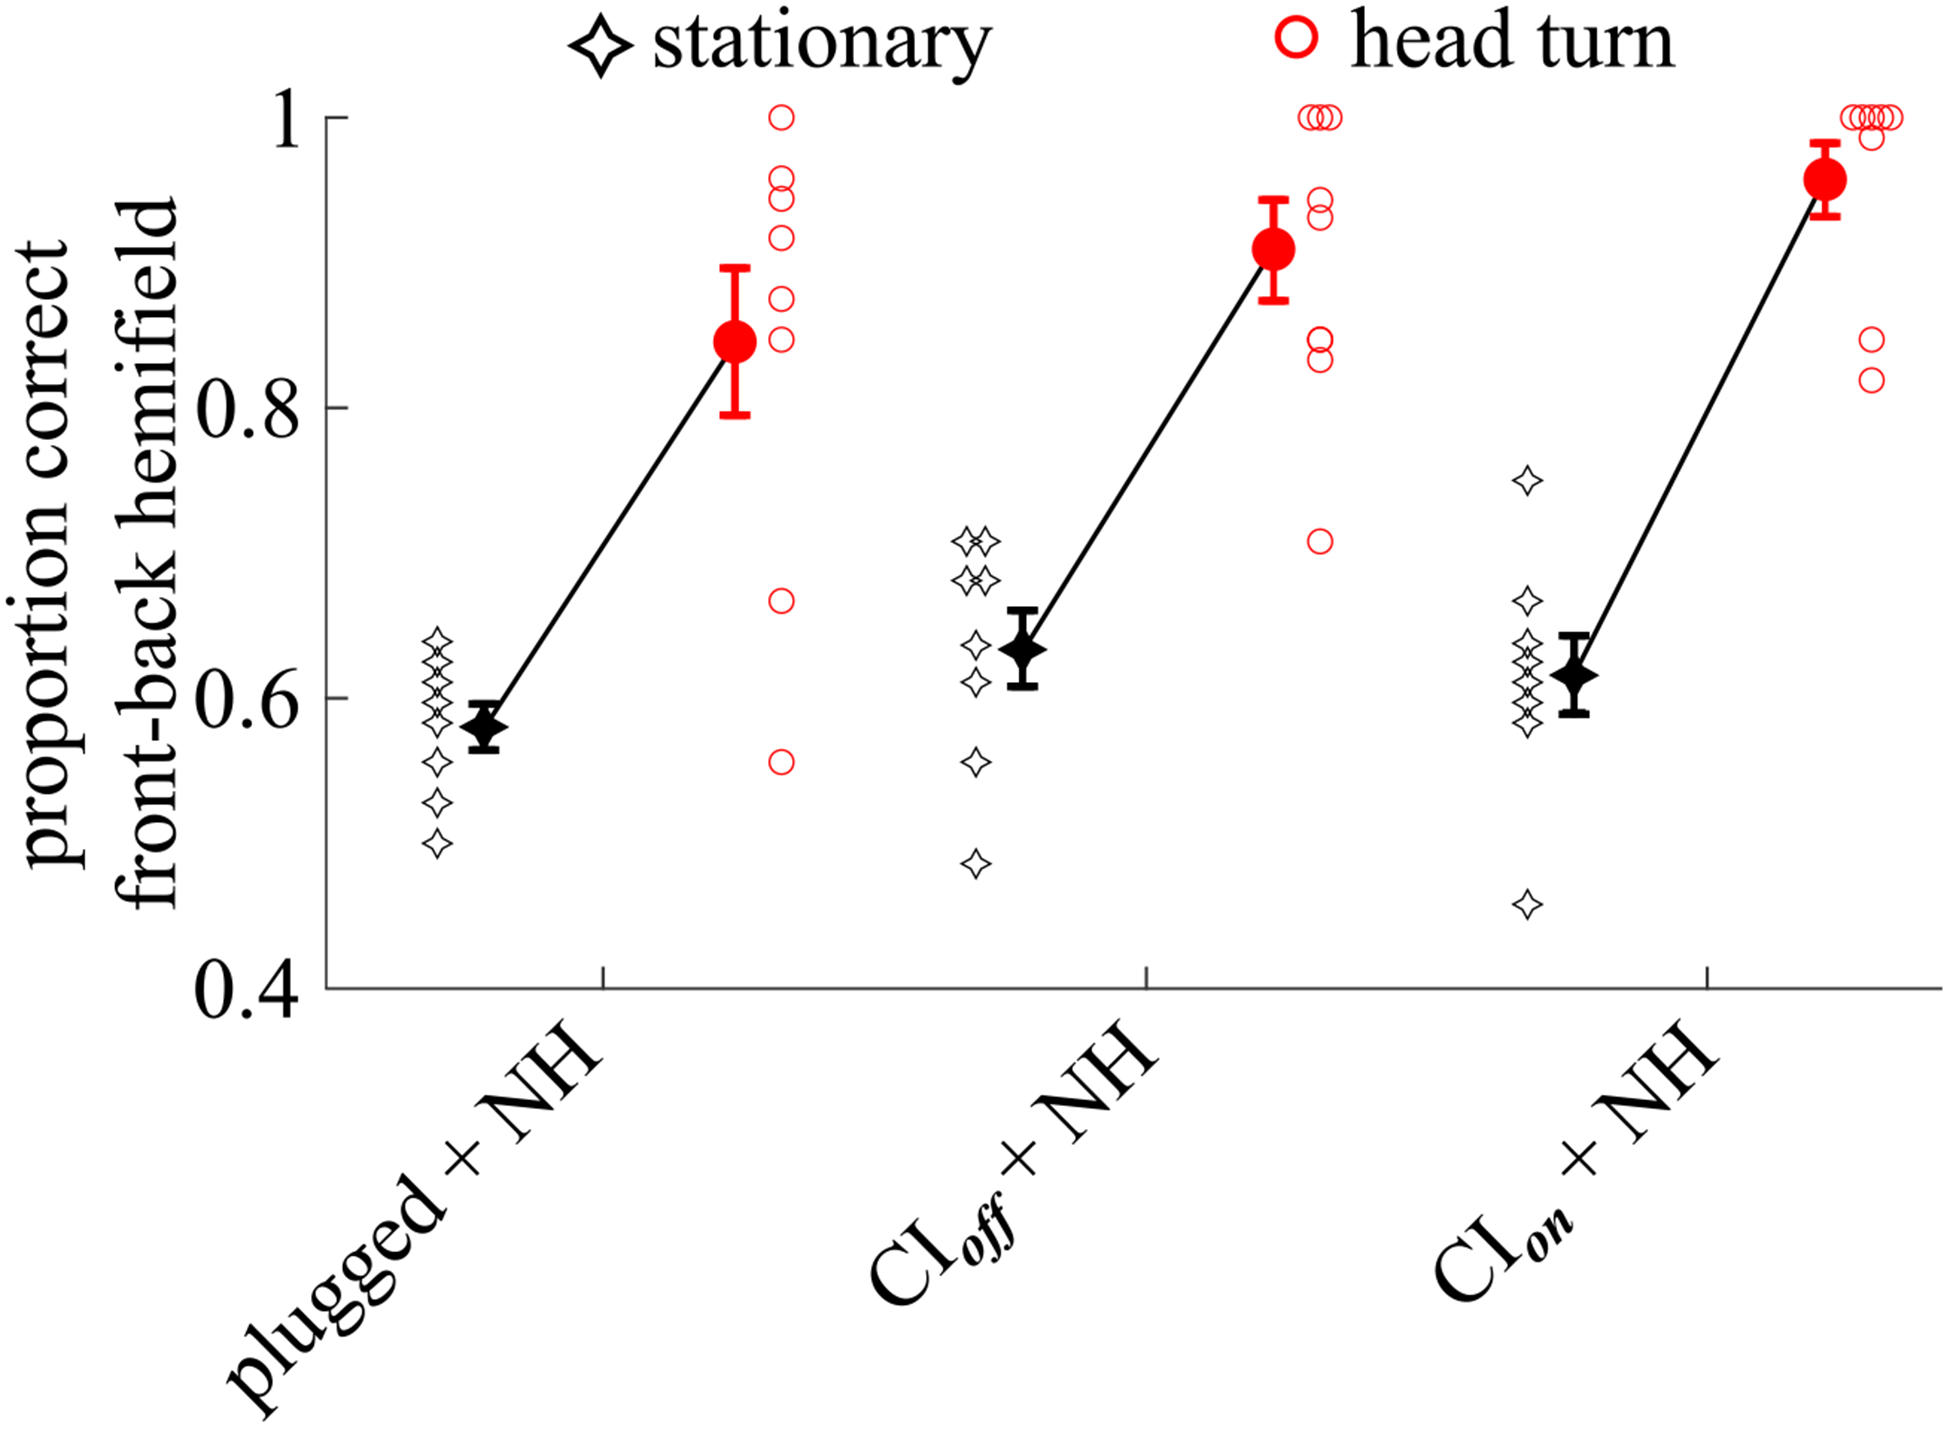
Fig. 3.

Individual and group data showing the proportion of responses that were in the correct front-back hemifield, collapsed across all presenting loudspeaker locations. Circles show data for the condition where listeners rotate their head. Diamond-like symbols show data for the condition where listeners keep their head stationary. Note that all individual listeners either improved or remained the same when allowed to move their head. Filled symbols, next to the individual data, show the group mean ± 1 standard error of the mean.
