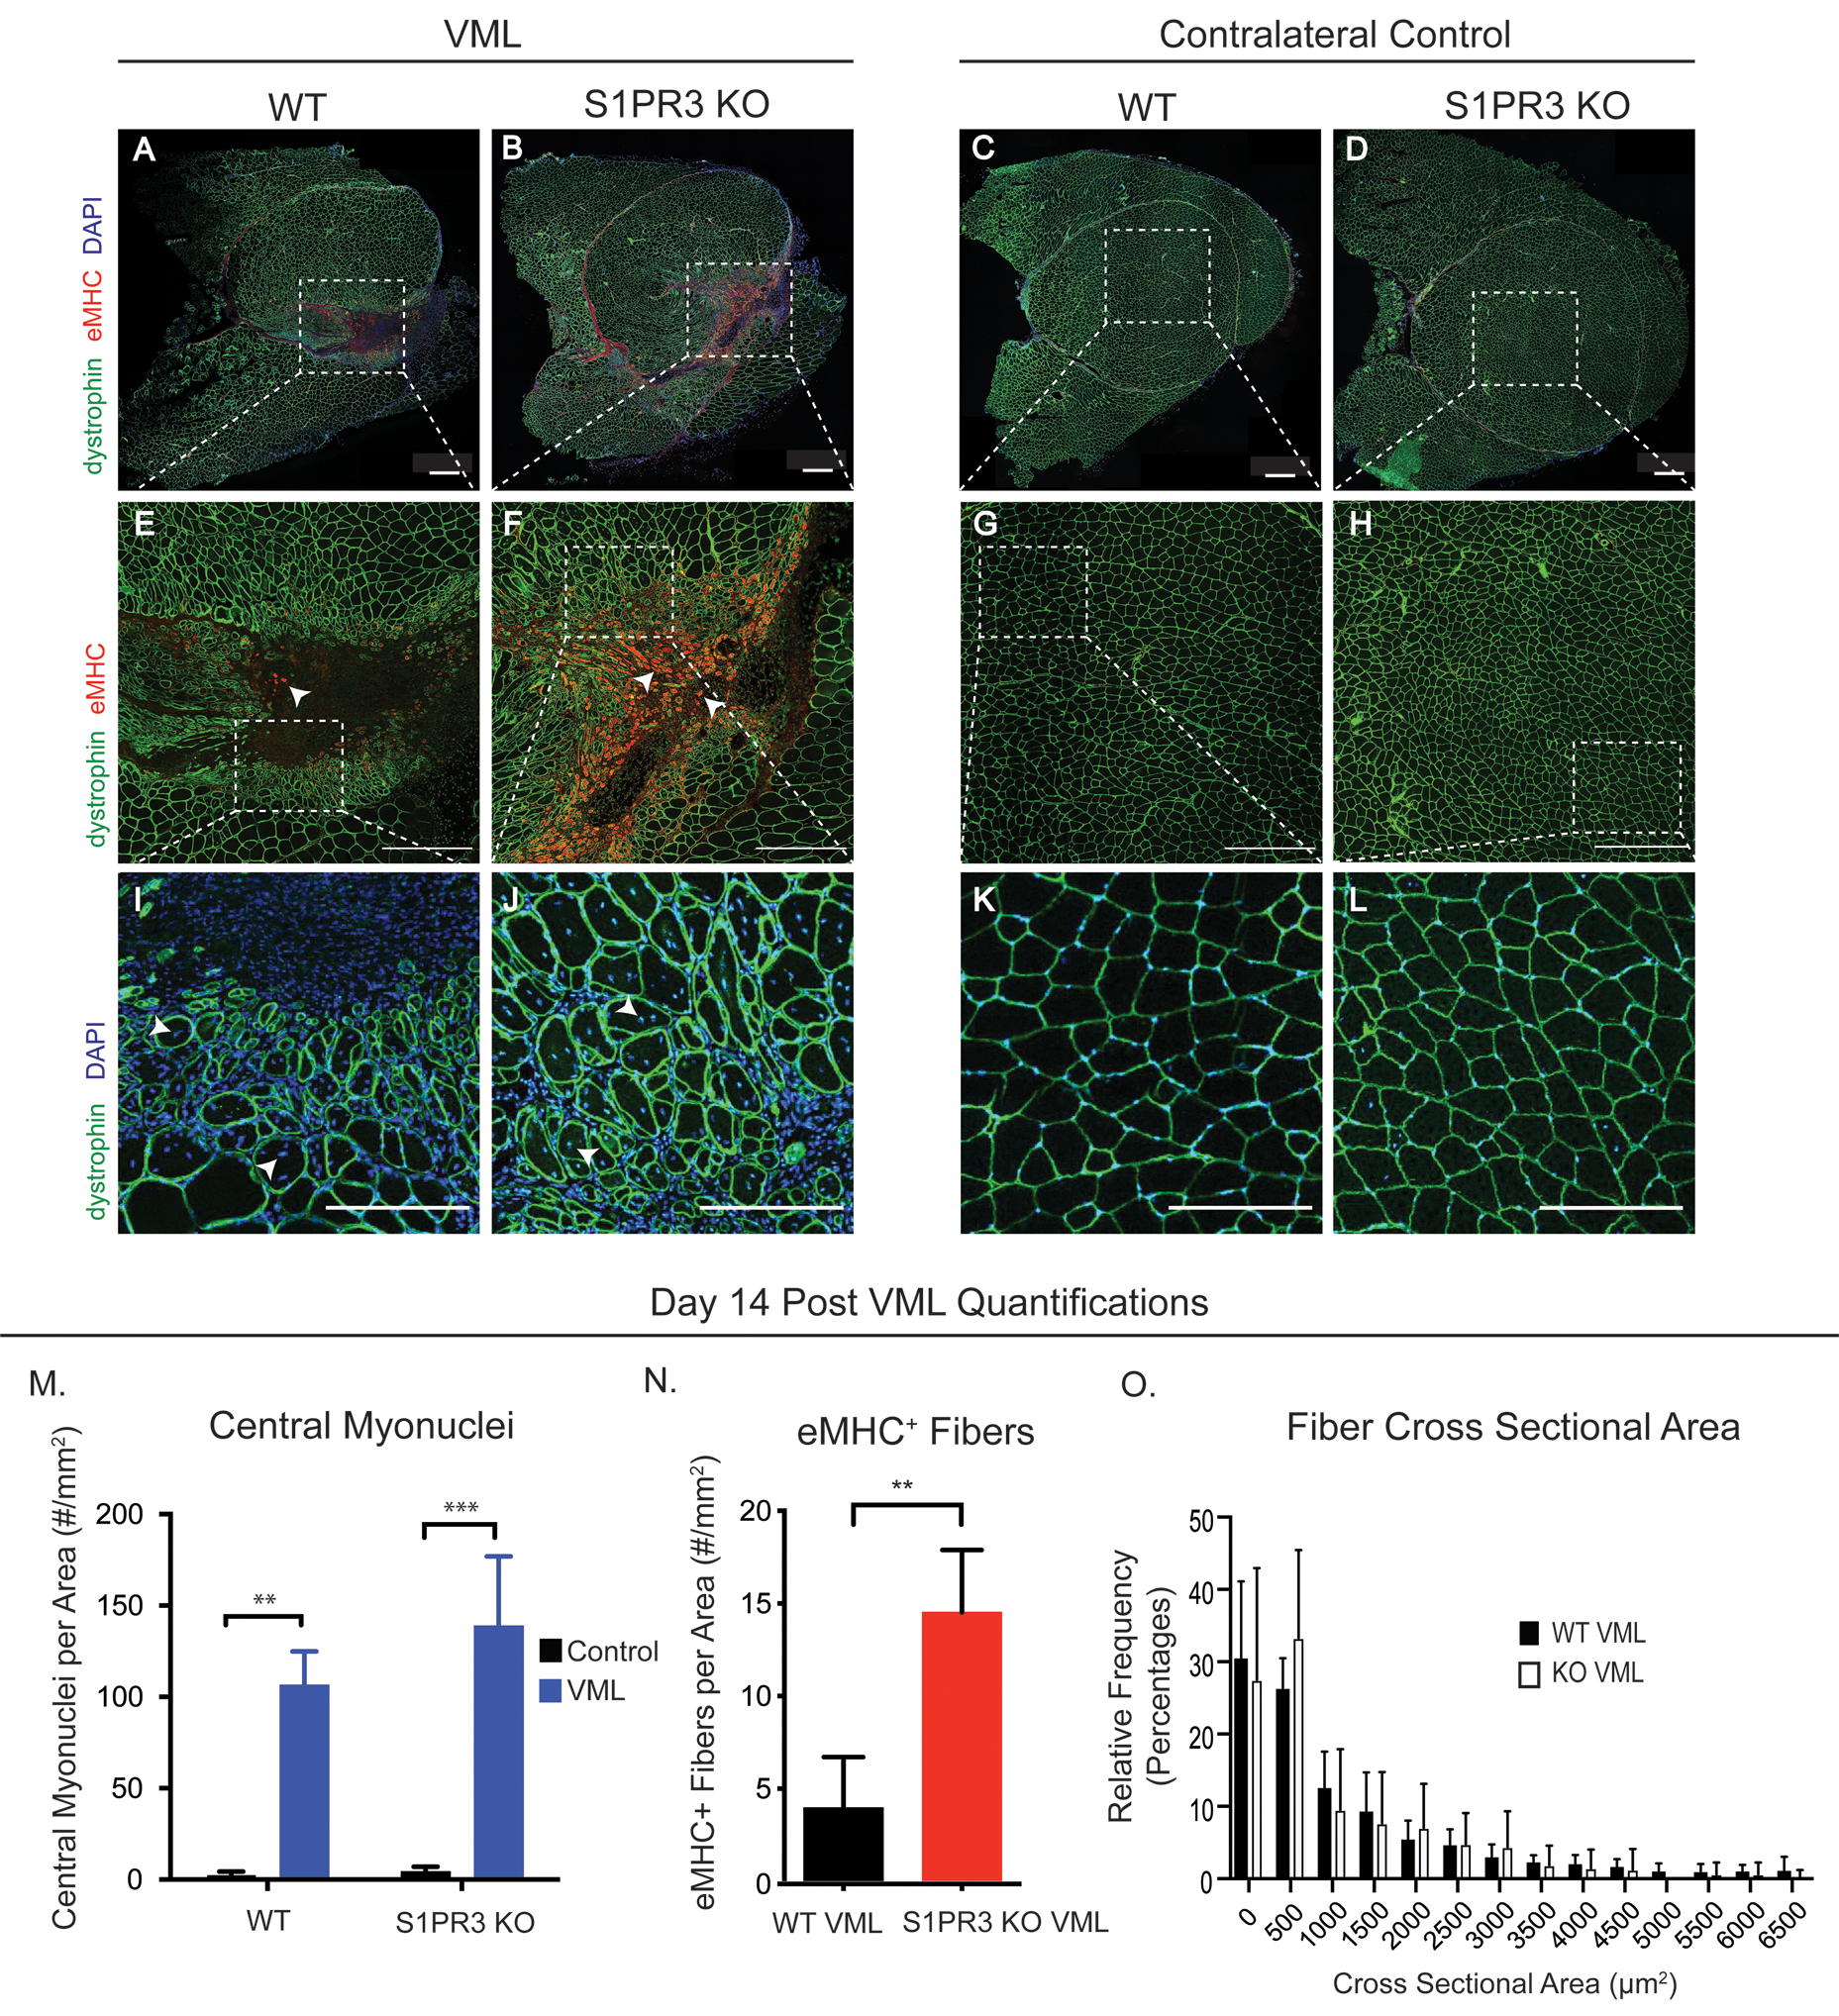
Figure 3. Lack of S1PR3 enhances regenerative metrics of muscle healing.

Representative immunofluorescence images of quadricep cross sections taken 14 days post 3mm full thickness VML injury. Muscle cross sections are stained for dystrophin (green), eMHC (red), and DAPI (blue). Quadriceps with a VML defect are seen in the left panel while uninjured contralateral control quadriceps are seen in the right panel, each including WT and S1PR3 KO mice. The first row of images (A-D) are full cross quadricep cross sections with all 3 stains depicted in the images. Dotted white boxes in injured sections (A, B) or uninjured sections (C, D) illustrate the defect area, or lack thereof, within the cross section that is zoomed in on in the second row of images (E-H) where white arrows point to eMHC+ fibers. Dotted white boxes in the second row (E-H) represent the ROI for a third row of images in which we further zoom in to display myonuclei location within regenerating and naïve muscle fibers (I-L). White arrows point to the centrally located myonuclei in regenerating fibers (I, J) while DAPI+ nuclei are located in the periphery of the fibers of contralateral quadriceps (K, L). (M) Centrally located nuclei in WT and S1PR3 KO mice with VML injuries compared to their contralateral controls. (N) eMHC+ fibers in VML defects from WT and S1PR3 KO mice normalized to cross sectional area. (O) Histogram of fiber cross sectional area between VML defects in WT and S1PR3 KO mice. Scale bars of 500μm (A-H) and 200 μm (I-L). Statistical tests conducted include two-way ANOVA with Tukey’s multiple comparisons (M) and two-tailed t-tests (N, O) with error bars representing standard deviation. n=4–8 samples per experimental group. **p< 0.01, ***p< 0.001
