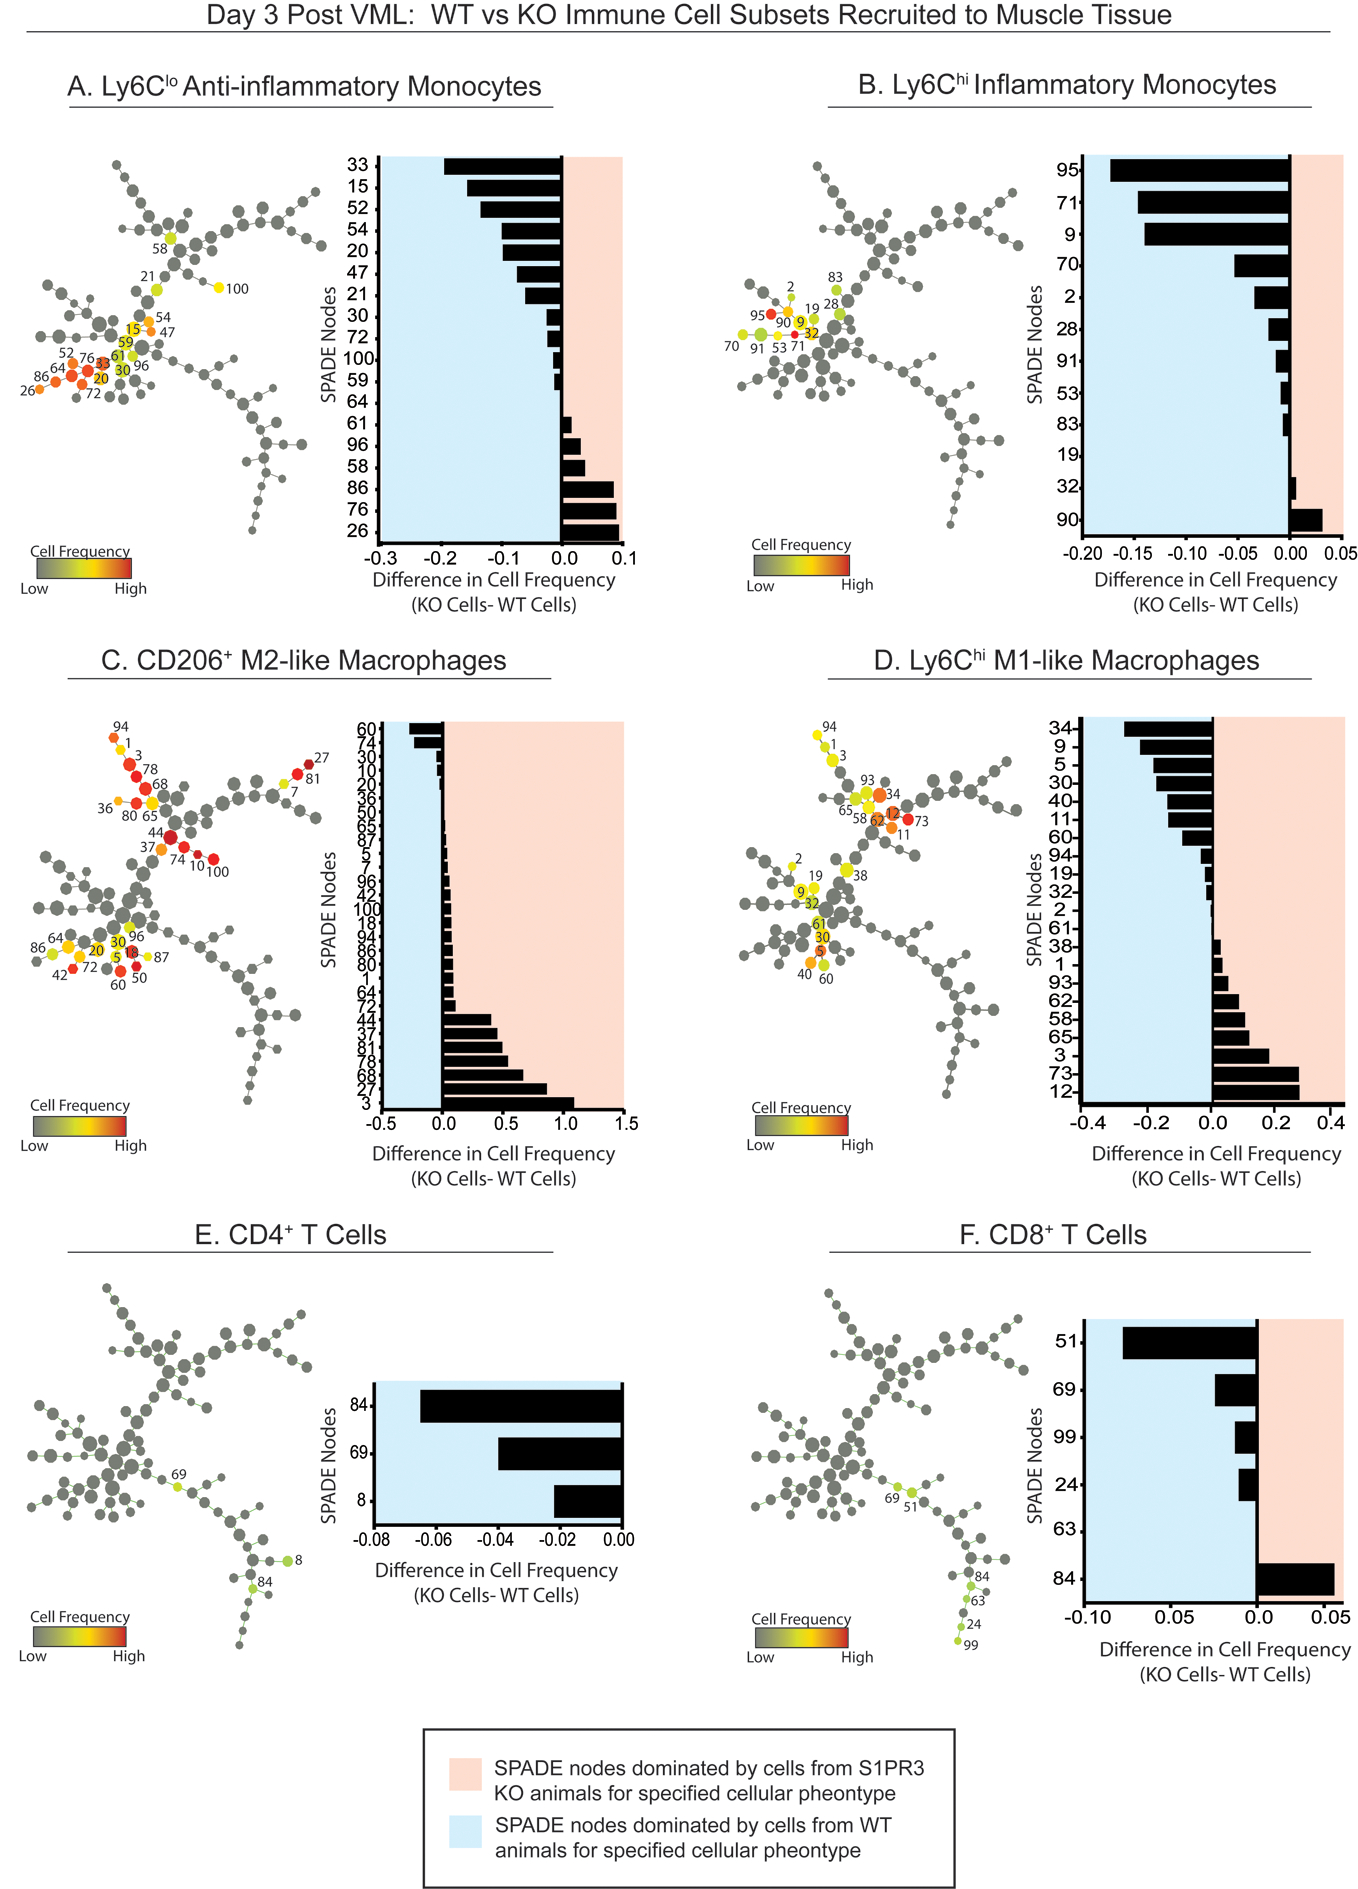
Figure 4. Pseudotime visualization of immune cell recruitment following injury in S1PR3 KO and WT control mice.

SPADE tree consisting of live, single cellular events extracted from the spinotrapezius muscle of S1PR3 KO and WT mice 3 days after volumetric muscle injury. Tree dendrograms are annotated to distinguish the different immune cell subpopulations that emerge through pseudotime trajectory projections after initial sequential biplot manual gating analysis. All SPADE nodes are visualized in grayscale so that color annotation overlay in each panel permits visualization of the normalized cell frequency within the node for each manually gated cell type (A-F) in the form of a heatmap. From SPADE tree dendrograms, corresponding tornado plots can be created to represent the difference in average cell frequency percentage between S1PR3 KO (KO) mice and WT controls for each cellular phenotype. SPADE node number assignments annotated on the dendrogram trees correlate to the node assignment on the y-axis of the accompanying tornado plot. n=7 samples per genotype.
