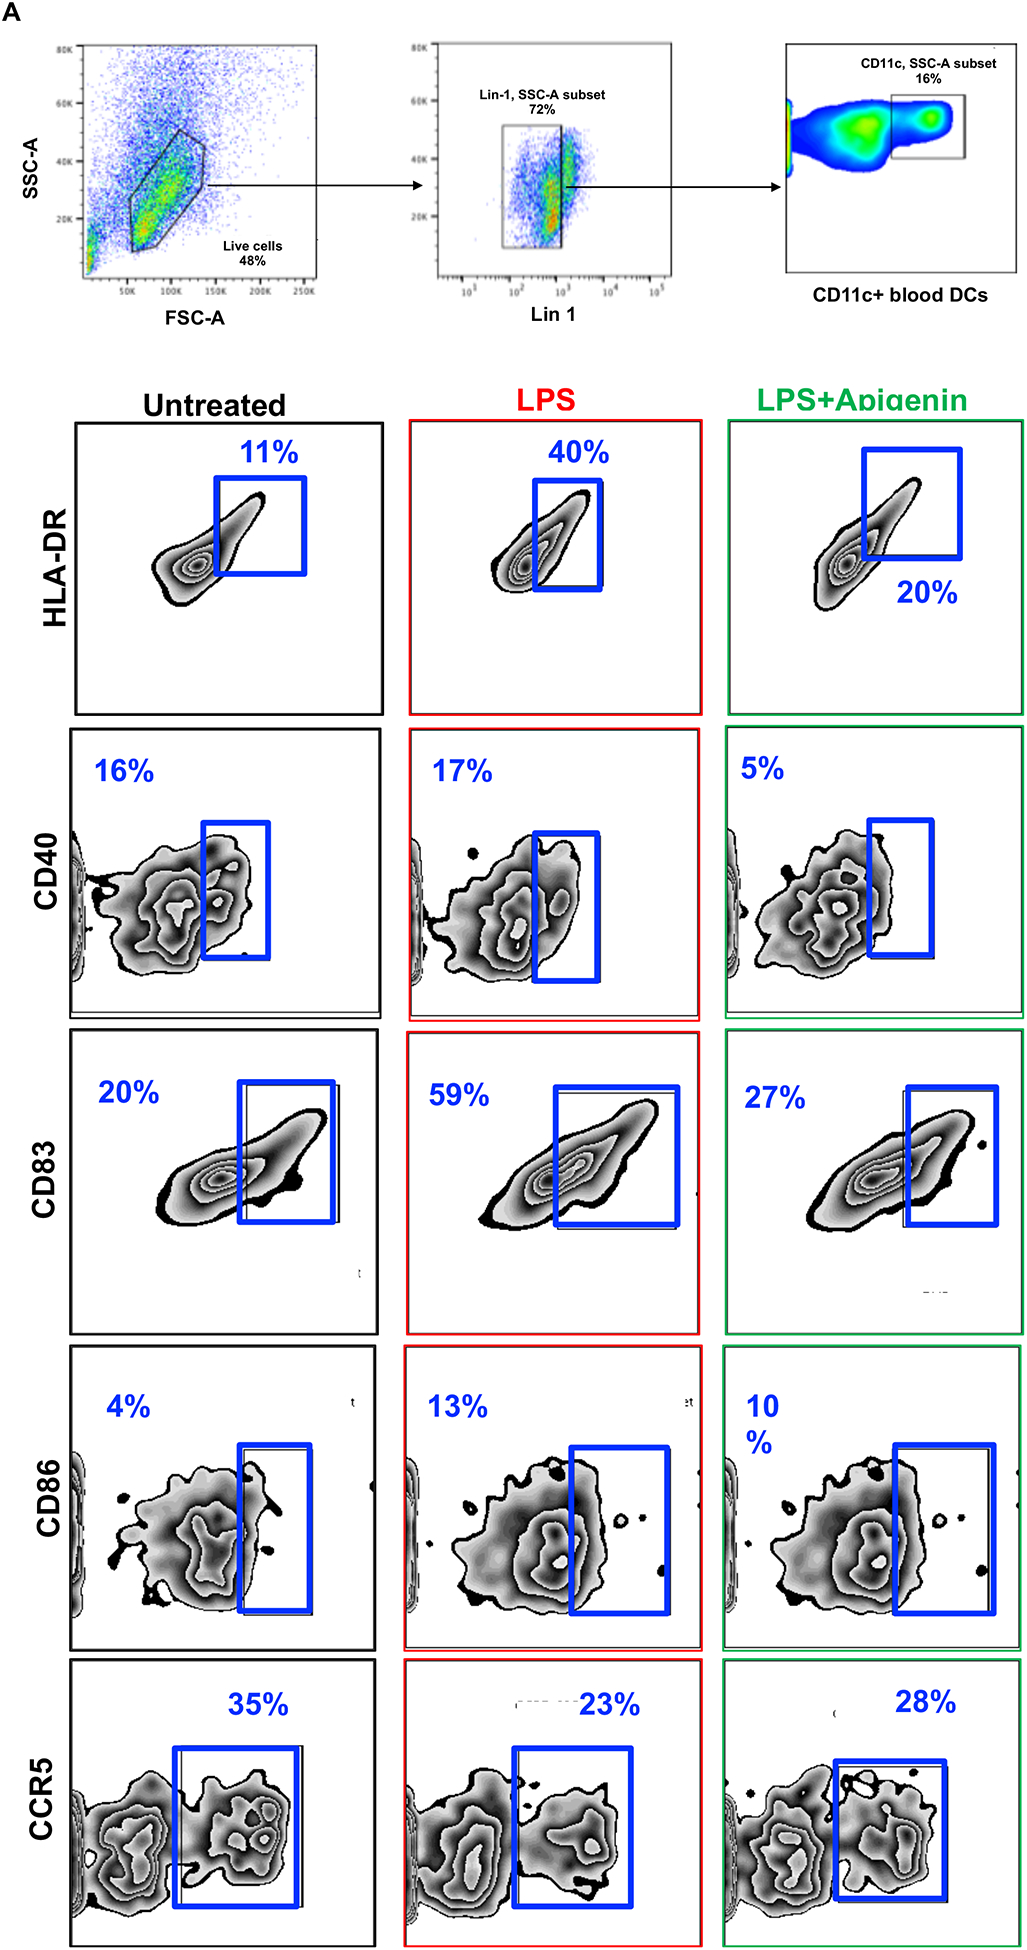
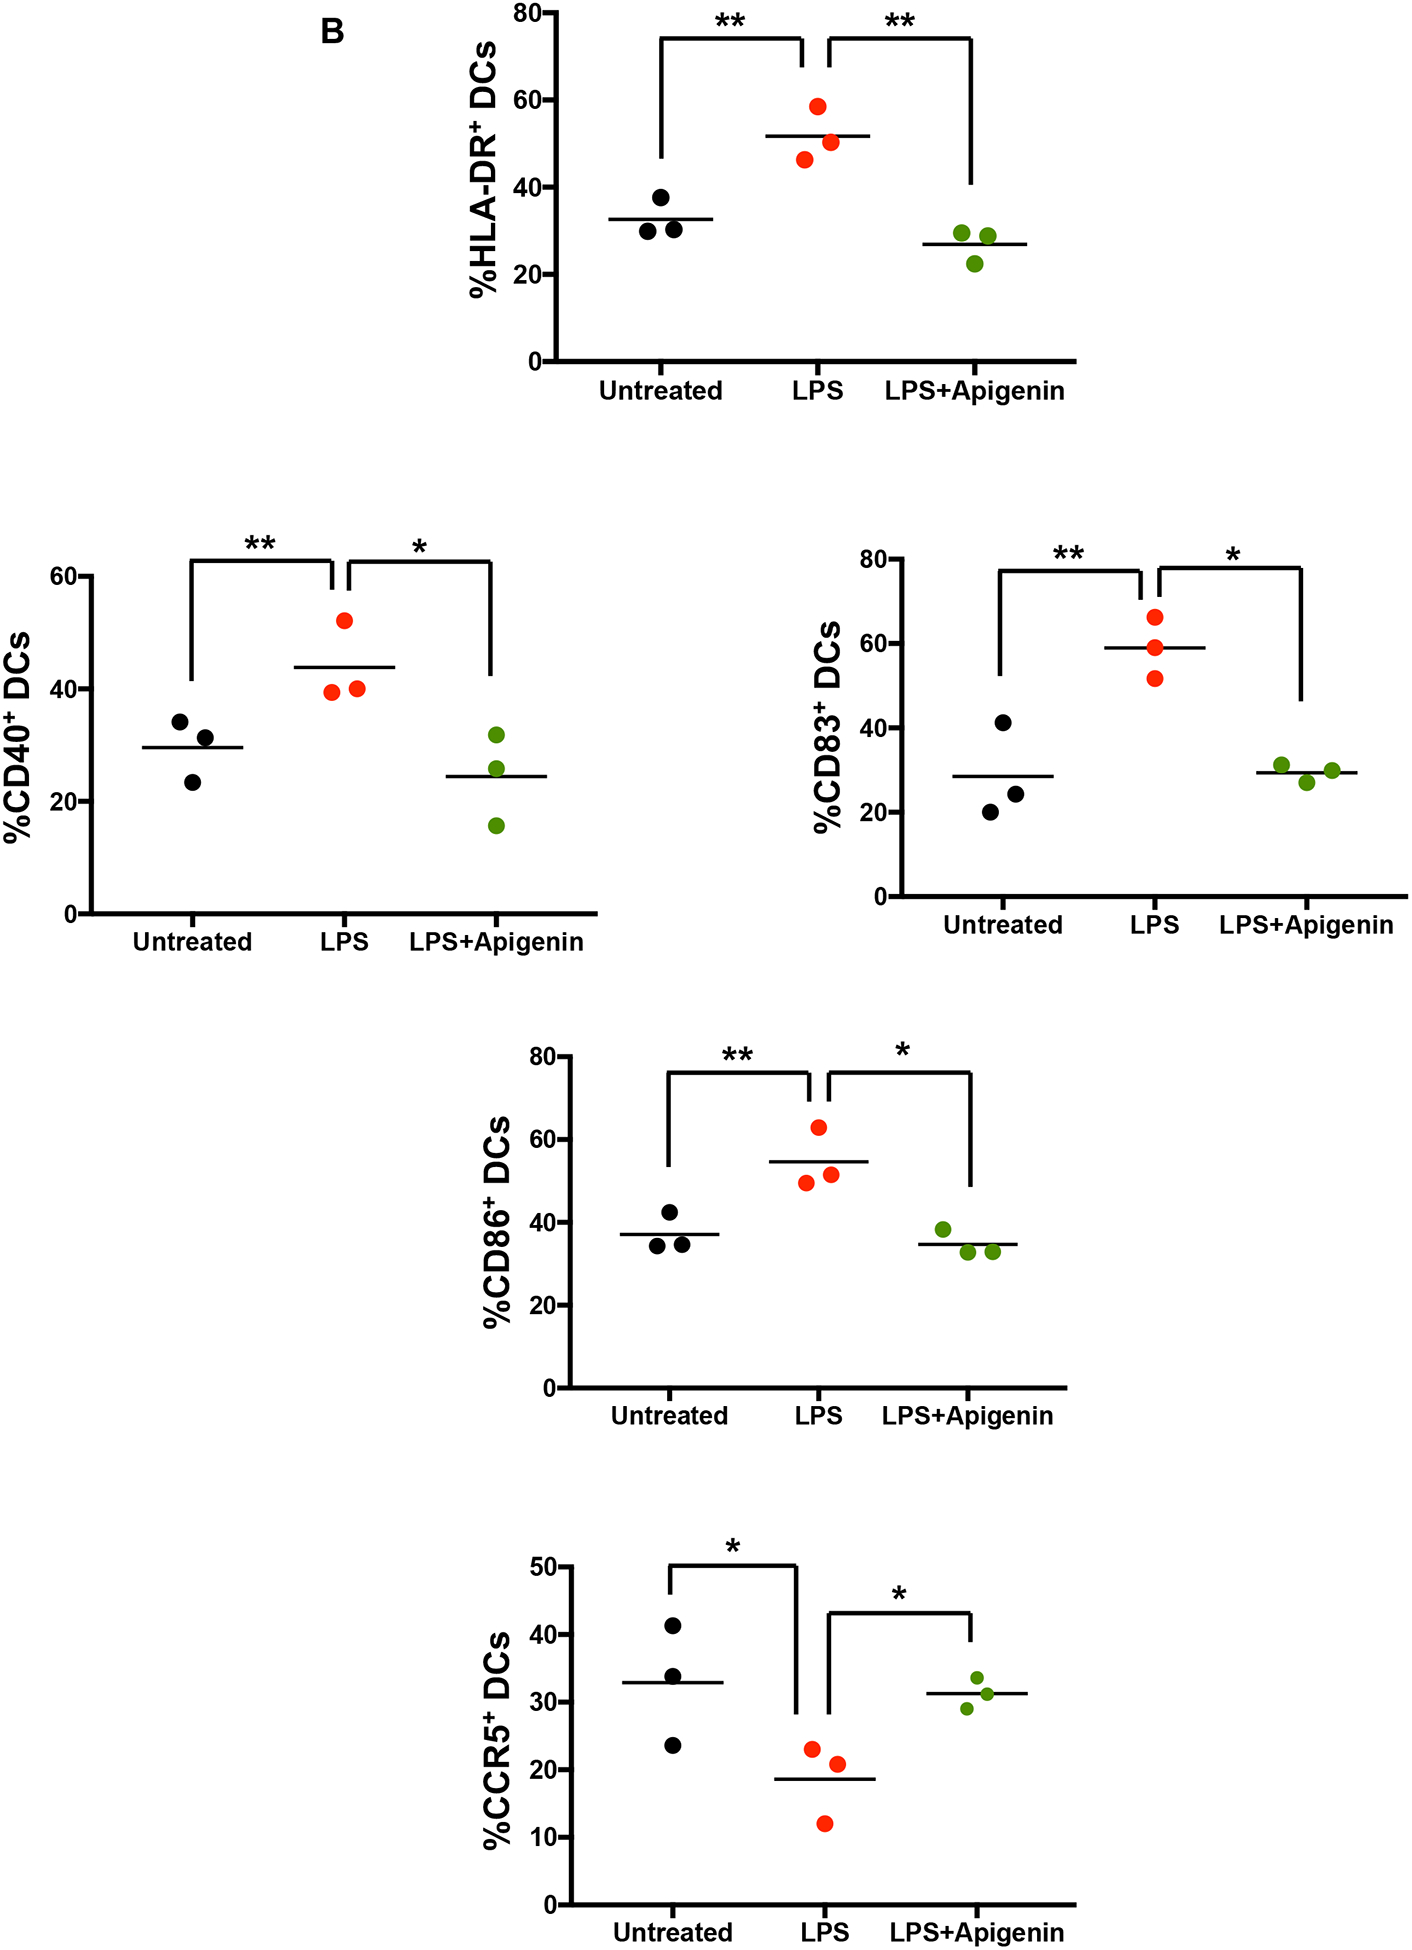
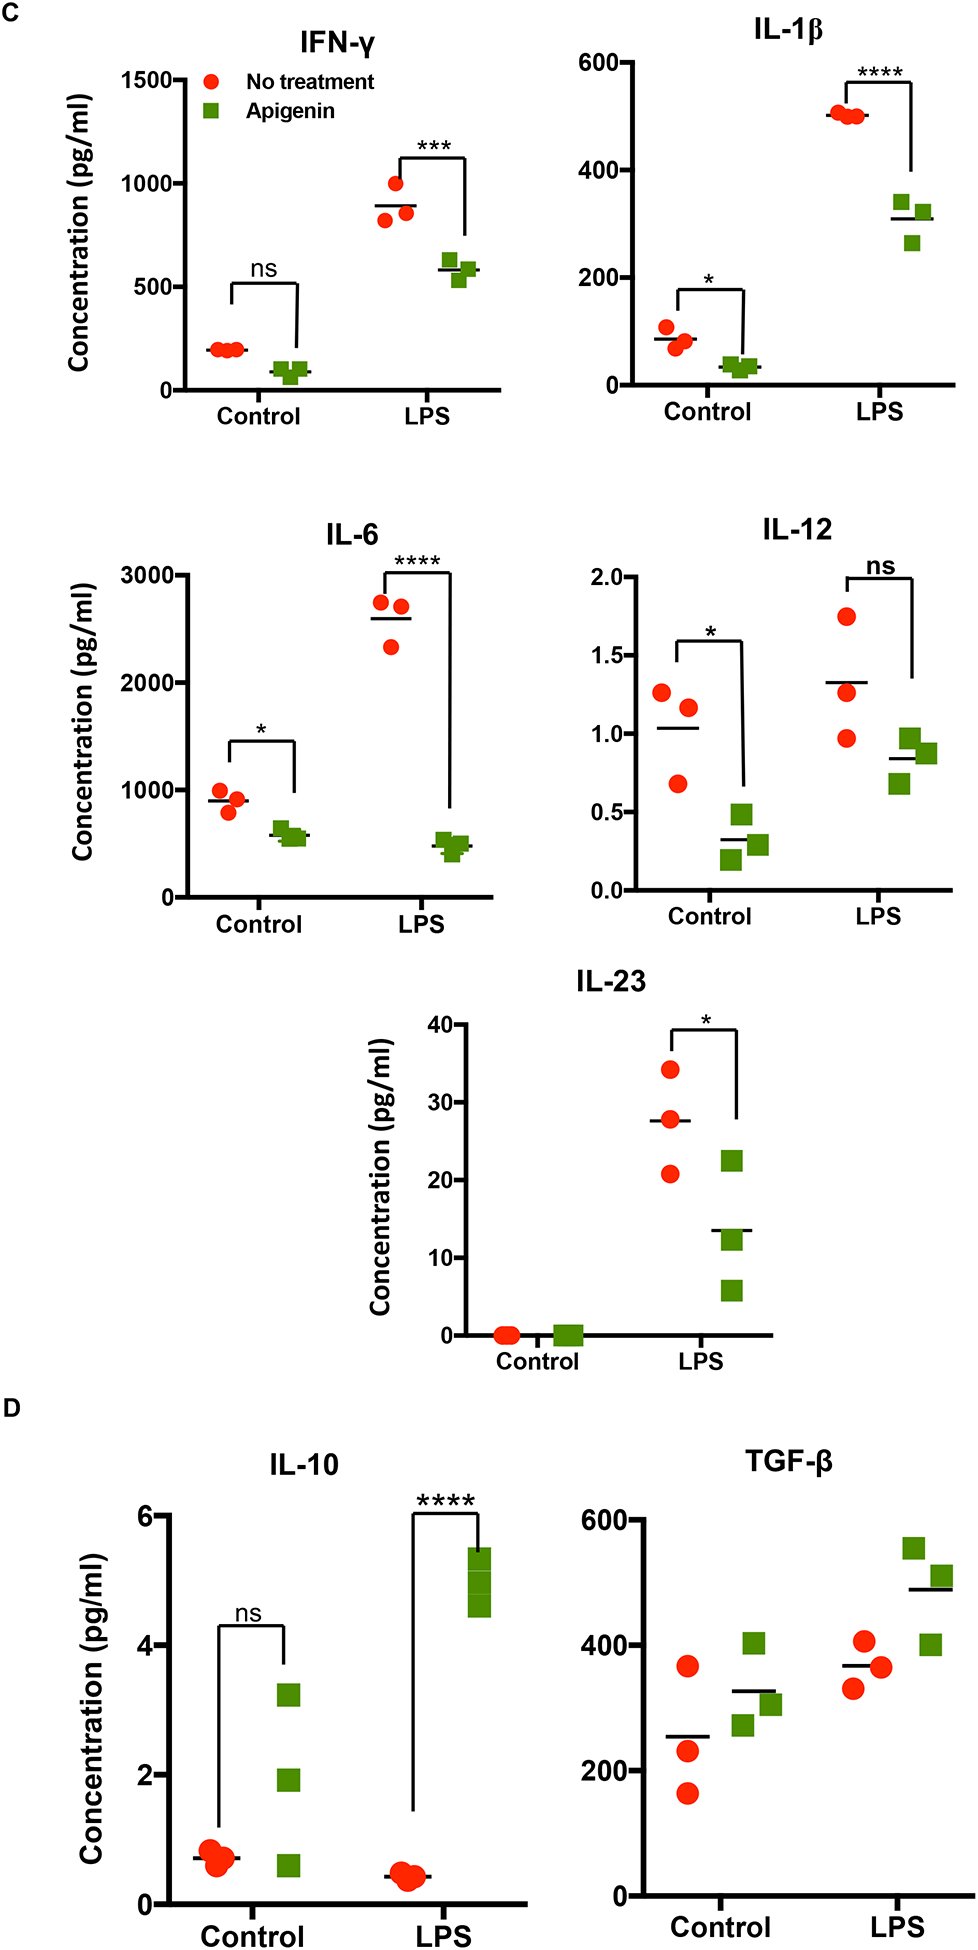
Figure 2. Apigenin modulates both phenotypic and functional maturation in DCs.


DCs were isolated as described in Figure 1. DCs were stimulated with and without LPS for 24h. DCs were then treated with Apigenin (20μM) for 3h. A) Antibodies against cell surface markers were used to stain human blood DCs and phenotypic expression was determined by flow cytometry. Each FACS plot is representative of three individual donors. B) Quantitative representation of FACS plots shown in A (N=3). Culture supernatants were extracted and C) pro-inflammatory cytokine IFN-γ, IL-1β, IL-6, IL-12, and IL-23 and D) anti-inflammatory cytokine IL-10 and TGF-β levels were detected by ELISA. FACS plots are representative of results from three individual donors. Statistical significance was determined by Student’s t-test for data shown in A and B. Statistical significance was derived by 2-way ANOVA using Sidak’s test for multiple comparisons for data shown in C and D (*p<0.05, **p<0.01, ***p<0.001, ****p<0.0001).
