
Figure 3. Modulation of T-cell responses by Apigenin treated DC.
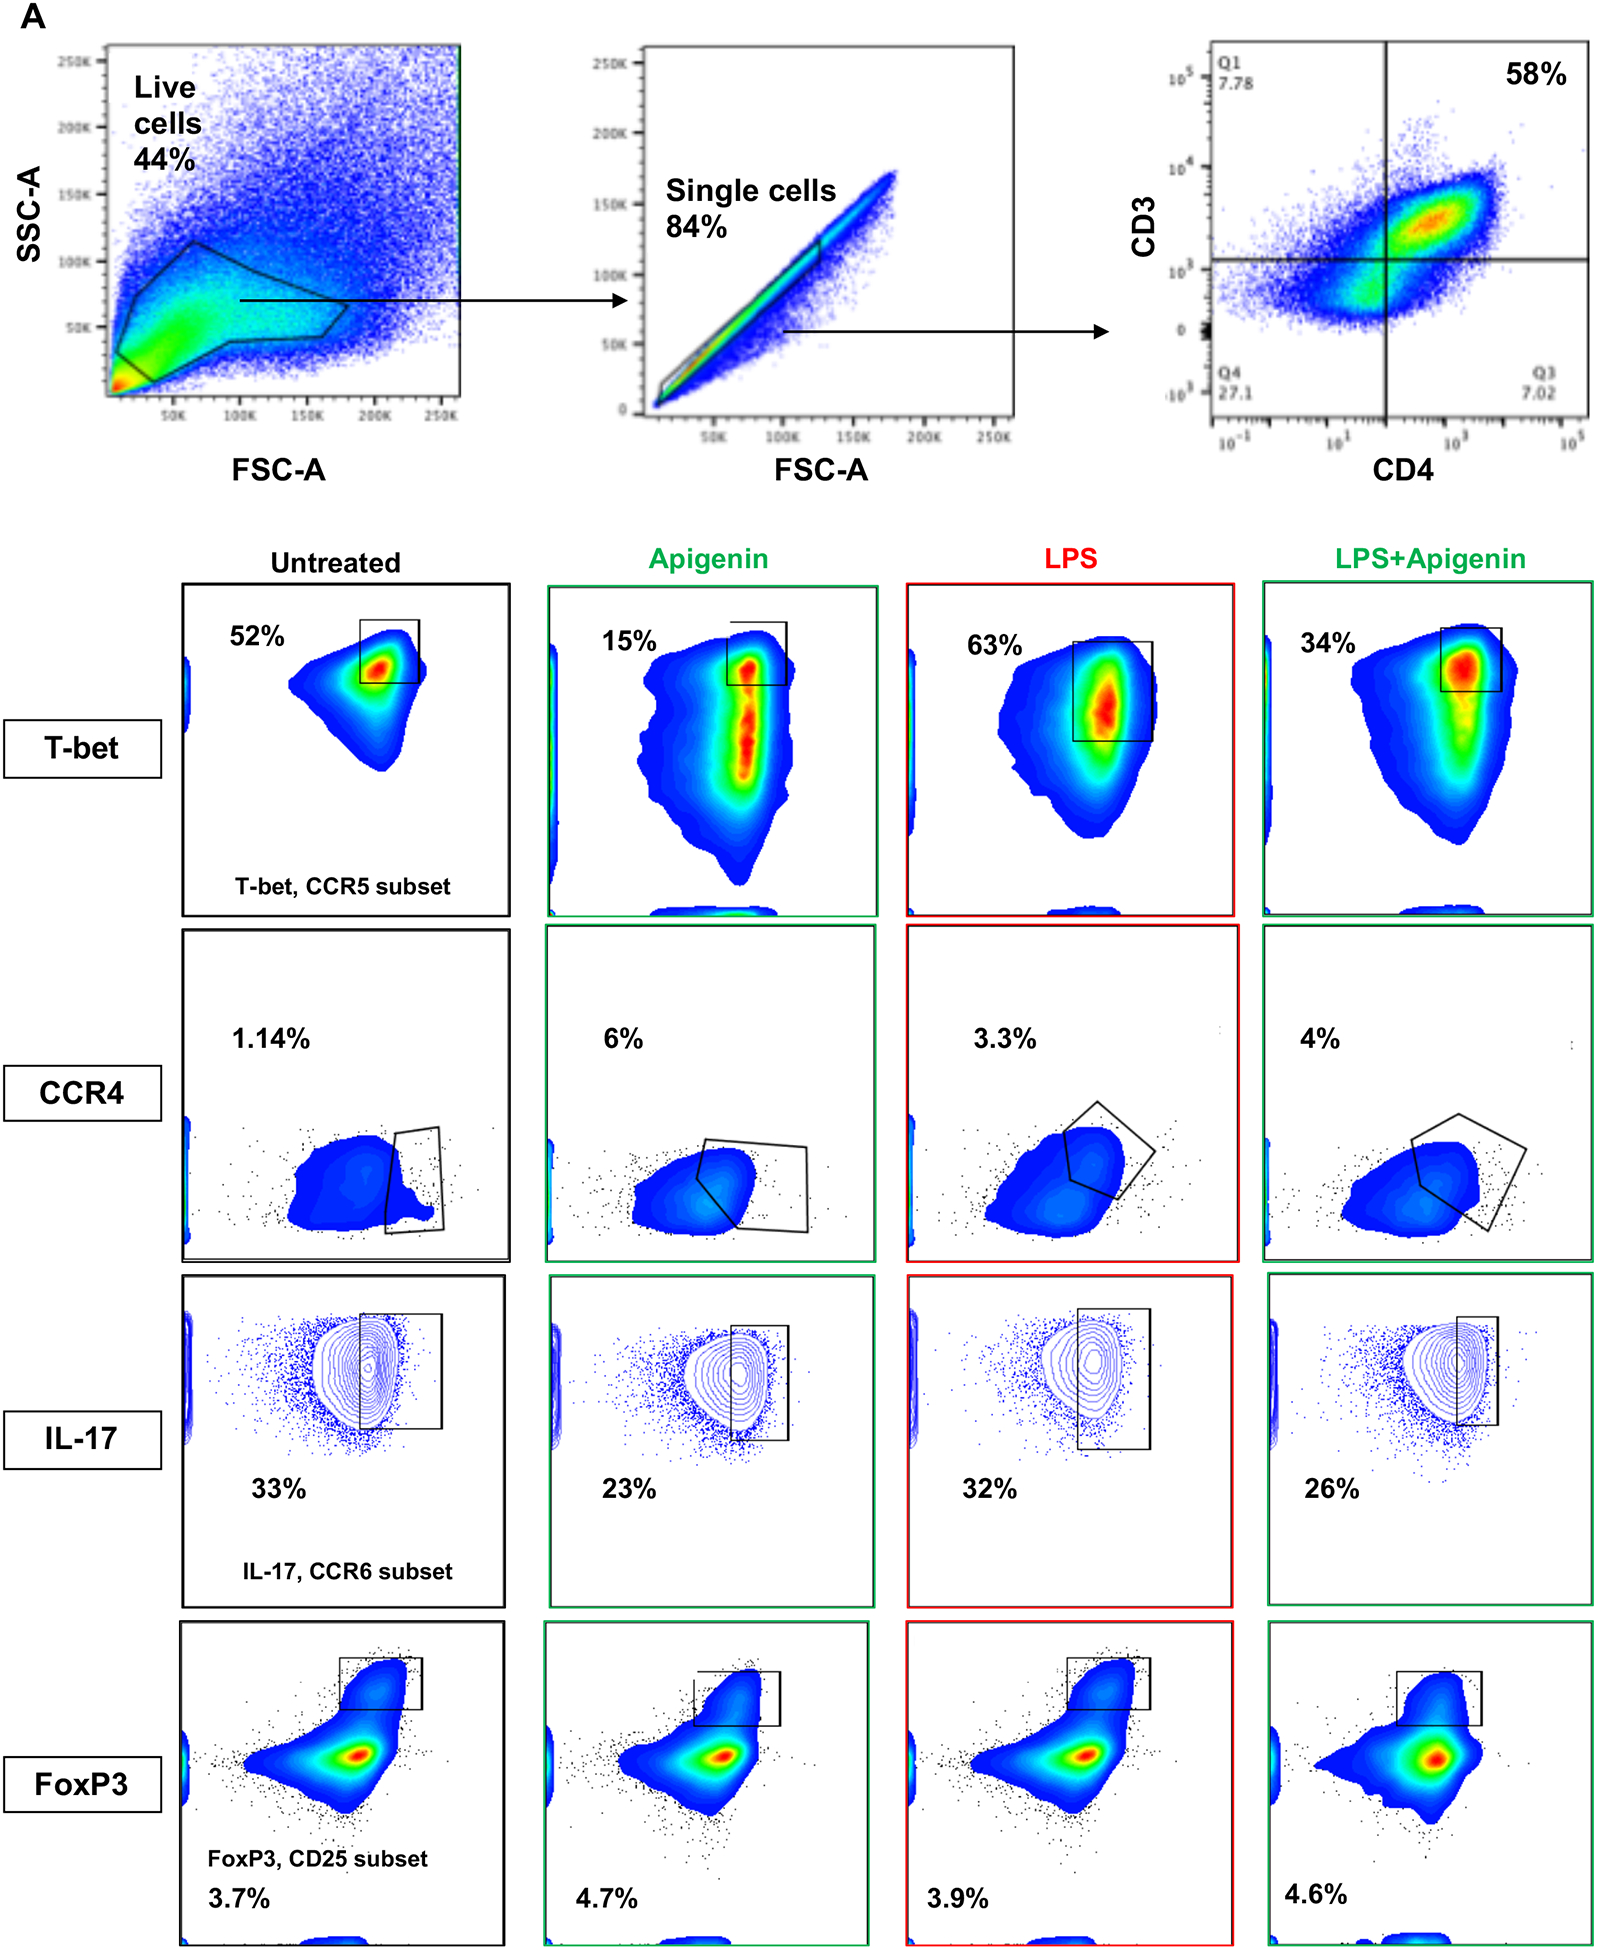
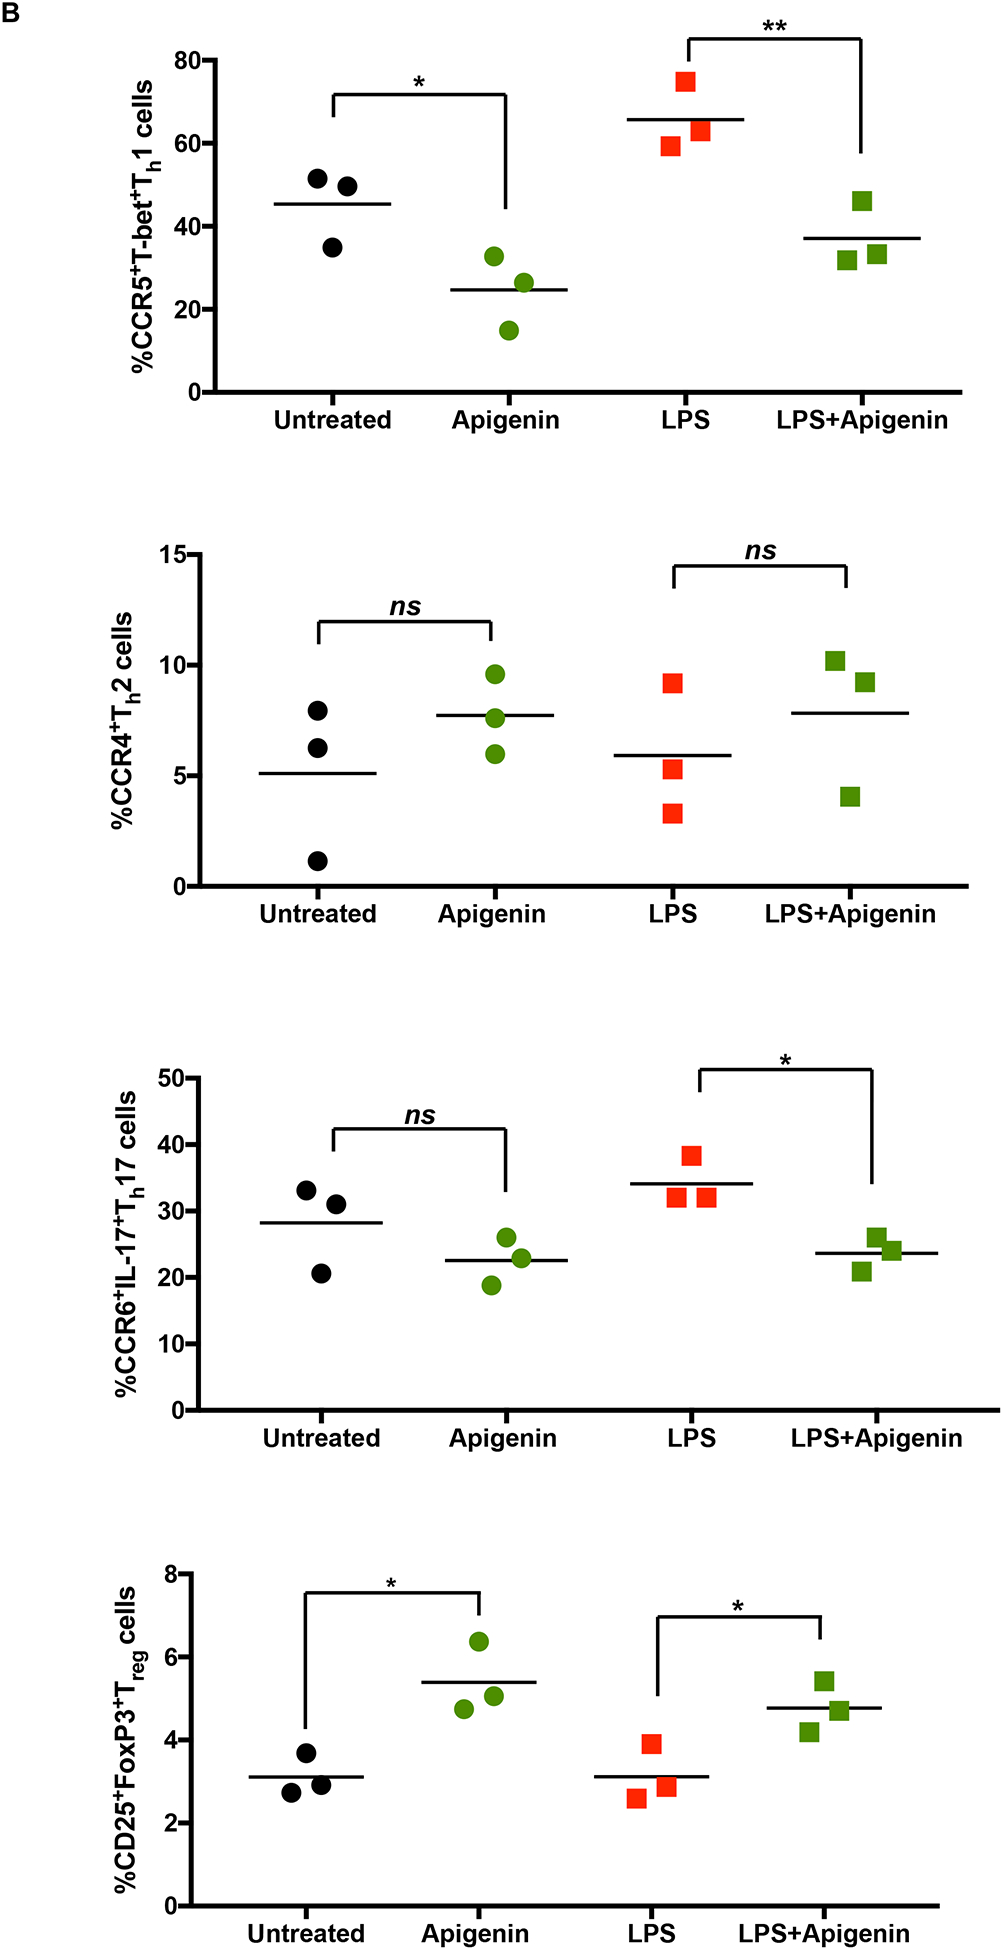
DCs from three donors were isolated as in Figure 1. DCs were cultured with and without LPS for 24h followed by 3h of 20μM Apigenin treatment. DCs were then co-cultured with autologous PBLs for 6 days with Brefeldin A and Monensin treatment in the last 16h of the co-culture. T-cell phenotype was elucidated by staining for various cell surface markers and transcription factors and the cells were analyzed by flow cytometry. A) FACS plots of T-cell subset-specific expression of transcription factors or cytokines. B) Quantitative representation of FACS plots shown in A (N=3). Statistical significance was determined by Student’s t-test (*p<0.05, **p<0.01, ***p<0.001).