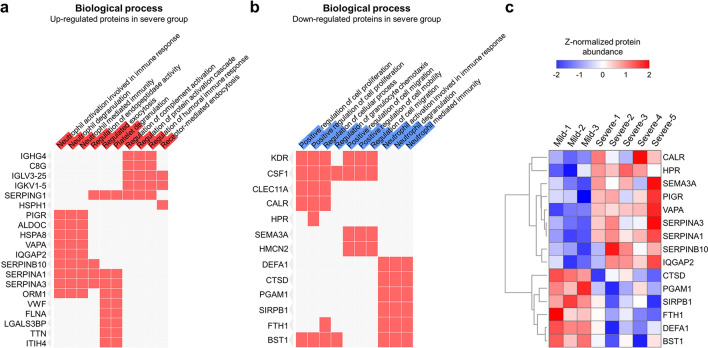
Figure 4.
Functional analysis of differentially expressed proteins. (a,b) Biological function enrichment analysis was performed using the upregulated or downregulated DEPs. If the proteins on the left side were associated with the corresponding function, then they were filled with red. The level of significance of each biological function is displayed as the length of red (a) and blue (b) bars overlapped in the function term cell. (c) The expression levels of the 15 proteins associated with neutrophils were plotted.

