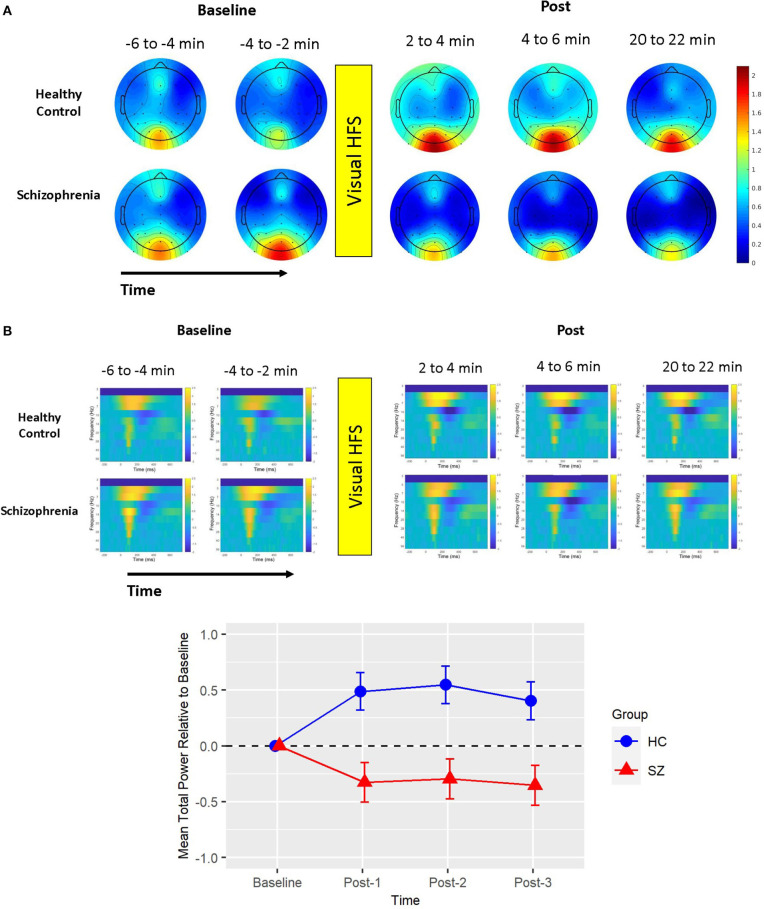
Figure 2.
Mean total power. (A) Voltage scalp topography maps are shown for the mean total power cluster, demonstrating prominent occipital/posterior activity. Topography maps are shown for each pre-VHFS and post-VHFS assessment block by group. All maps are plotted on the same voltage scale (μV) as indicated in the legend. (B) Group average mean total power values are shown over the first 800 ms following the onset (time = 0) of checkerboard stimuli. Total power plots are presented for healthy controls (top) and schizophrenia patients (bottom) for each assessment block pre- and post-VHFS. (C) Graph showing change in mean total power in the identified cluster, which comprised of 5 Hz (theta) activity in the 0–450 ms time window, for post-VHFS assessment blocks relative to baseline. VHFS enhanced mean total power across post-VHFS blocks relative to baseline among healthy controls (shown in blue), whereas individuals with schizophrenia (shown in red) demonstrated a trend toward reduced mean total power baseline. Error bars denote standard errors within groups.

