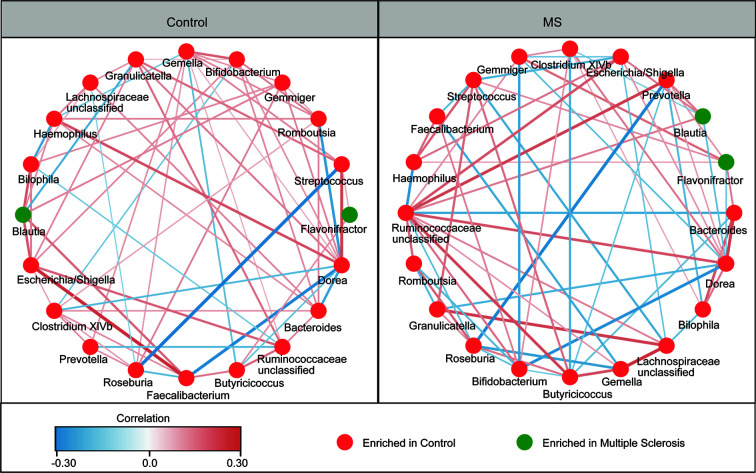
Figure 3.
Correlation strengths of the abundant fecal microbiota in Chinese patients with multiple sclerosis (MS) and healthy controls. Correlation network of the abundant fecal microbiota in healthy controls and in patients with MS. The correlation coefficients were calculated using the Sparse Correlations for Compositional data (SparCC) algorithm. Cytoscape version 3.4.0 was used for network construction. The red and blue lines represent positive and negative correlations, respectively. The correlation networks were observed to become simpler.

