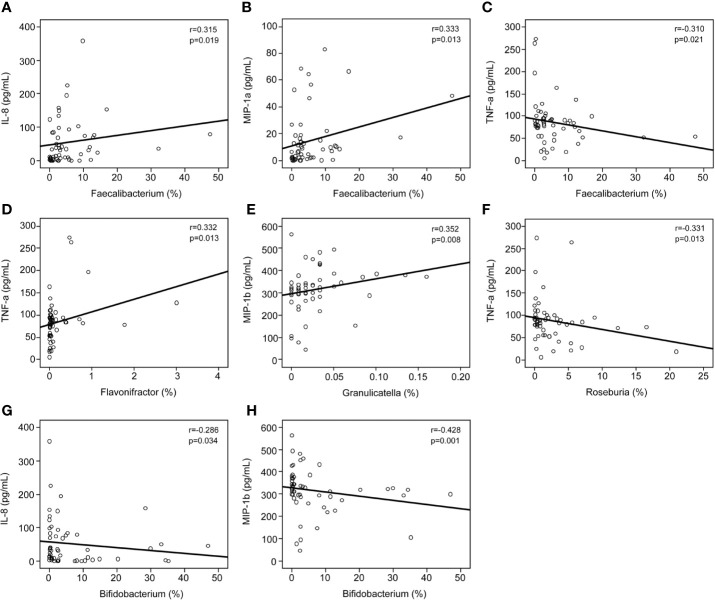
Figure 7.
Correlations between pro- and anti-inflammatory cytokines and chemokines with altered concentrations and the relative abundance of the key functional genera. Correlation between the relative abundance of Faecalibacterium and the levels of IL-8 (A), MIP-1a (B), and TNF-α (C); the relative abundance of Flavonifractor and the levels of TNF-α (D); the relative abundance of Granulicatella and the levels of MIP-1b (E); the relative abundance of Roseburia and the levels of TNF-α (F); and the relative abundance of Bifidobacterium and the levels of IL-8 (G) and MIP-1b (H). Spearman’s rank correlation (r) and probability (p) were determined to evaluate the statistical importance.

