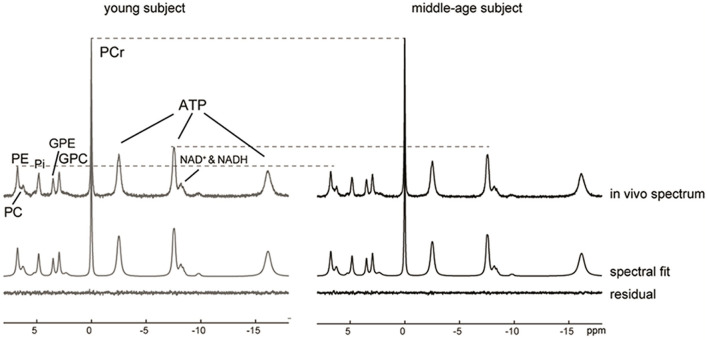
Figure 1.
31P MR spectra, LCModel spectral fits and fit residuals in the occipital lobe of a young and a middle-aged participant. No apodization was applied. For visual comparison, the baseline was removed by subtraction of the spline fit and the two spectra were then normalized to PCr peak height. A reduction in the ATP and PE peaks was observed in the middle-aged subject as indicated by the dashed lines.

