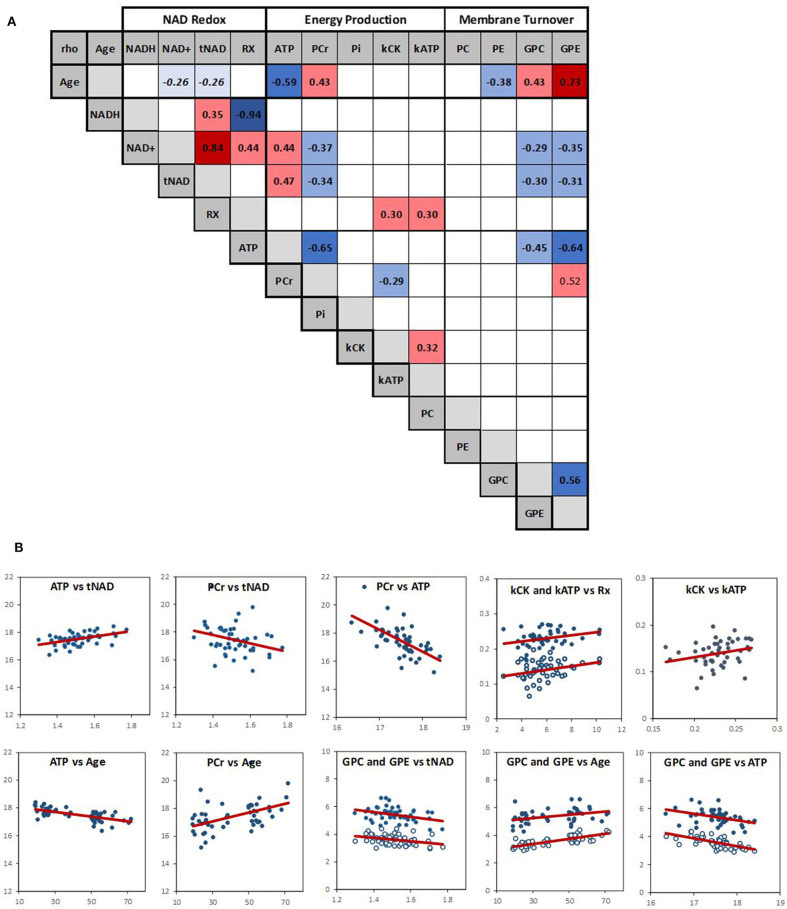
Figure 3.
(A) Spearman correlation matrix across the 14 variables (RX is NAD+/NADH redox ratio). Numbers are rho values, and color coding indicate a significant (p < 0.05) positive (red) or negative (blue) correlation. Color shading indicate strength of the correlation. There was a negative trend (p ~ 0.06) between age and NAD+ and tNAD. Empty squares indicate no significant correlation. (B) Scatter plots of the main correlations with red linear regression line; open circle: kATP and GPE.

