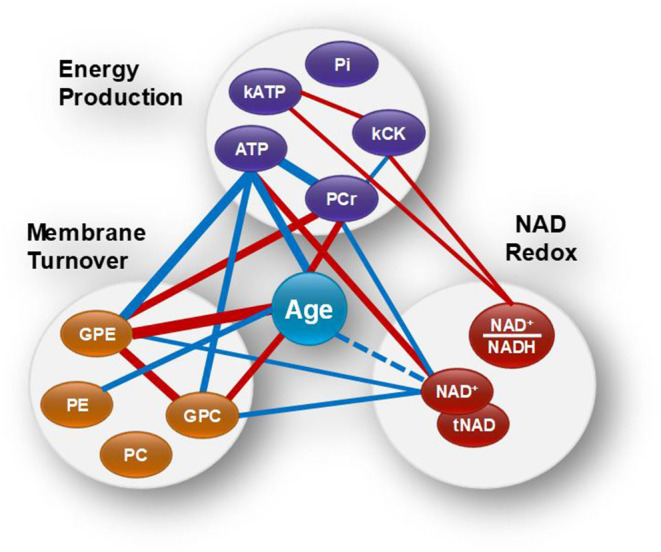
Figure 4.

Brain age and the networks between NAD status, energy production and membrane phospholipid metabolism. Red and blue lines indicate positive and negative correlations, respectively. Wider lines correspond to a stronger correlation. NAD+ and tNAD had similar network associations.
