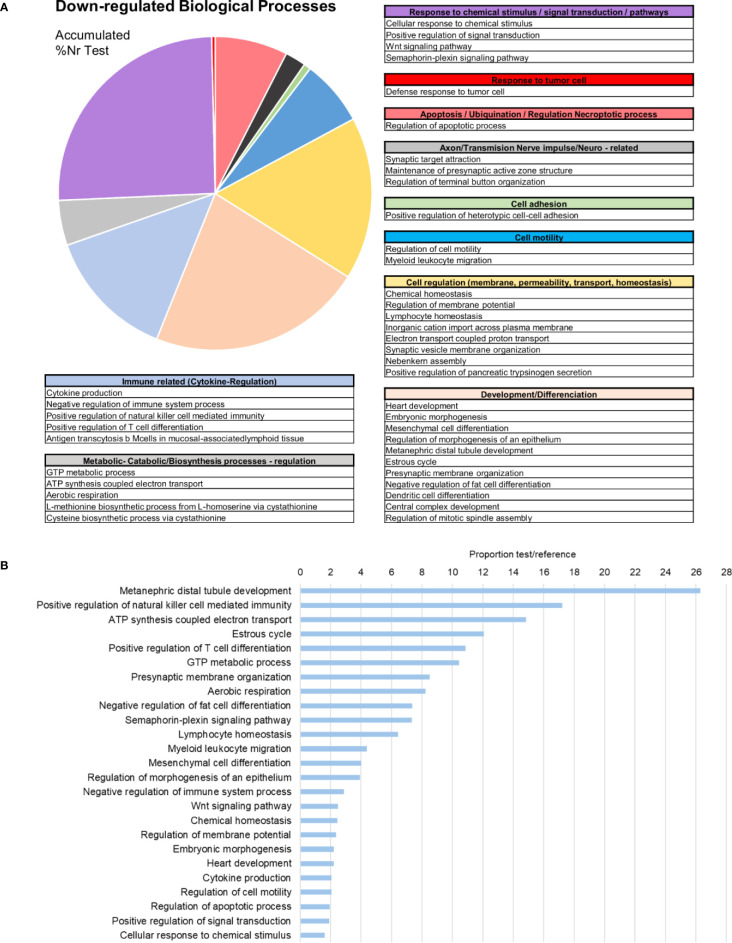
Figure 6.
Enrichment analysis of the downregulated differentially expressed genes (DEGs). (A) Biological processes classified in accordance with their biological functions and represented with their %Nr Test values (proportion of DEGs represented for each biological process divided by the total number of downregulated genes). (B) Enrichment analysis showing the most represented biological processes (proportion between the test and the reference set).

