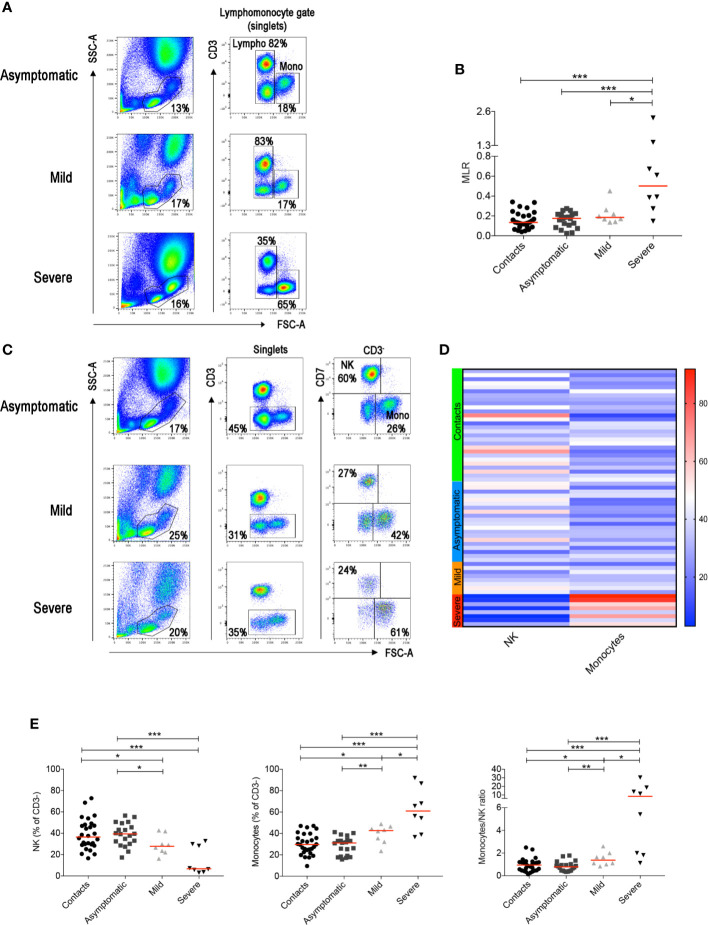
Figure 1.
(A) Flow-cytometry analysis of the monocyte to lymphocyte ratio (MLR) in the blood of three representative patients with asymptomatic, mild and severe disease. Total blood (EDTA) was stained with antibodies against CD45, CD3, CD4, CD8, CD7, CD56, CD16. The lympho-monocyte gate was designed based on physical characteristics (FSC-A vs SSC-A). Lymphocytes were gated as FSC-Alow and CD3+ or CD3− and monocytes as CD3− FSC-Ahigh. (B) Scatter plot depicts the MLR in the sixty-four adult patients enrolled in the study (contacts n = 28; asymptomatic n = 20; mild n = 8; severe n = 8). (C) Gating strategy used to identify natural killer (NK) and monocytes inside the CD3- cells in three representative patients with asymptomatic, mild and severe disease. NK cells were defined as CD3−CD7+FSC-Alow and monocytes as CD3−CD7−FSC-Ahigh. (D) Heatmap shows percentages of NK and monocytes in contacts (indicated by the light green bar), asymptomatic (blue), mild (orange) and severe (red) patients. Percentages are represented by the different expression of red, blue and white as indicated in the color code. (E) Plots indicate the frequency of NK, monocytes and the monocytes/NK ratio (MNKR) in our patients. (B, E) Midlines indicate median. Statistical significances were determined using unpaired, two-tailed Mann–Whitney U-tests. *p ≤ 0.05, **p < 0.01, ***p < 0.001.

