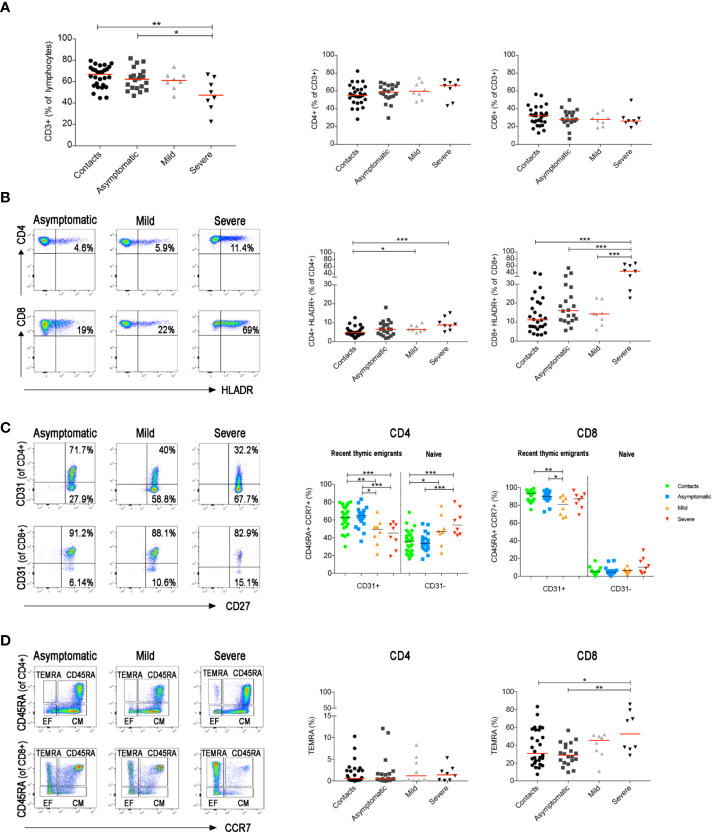
Figure 4.
Total blood was stained with antibodies against CD45, CD3, CD4, CD8, CD14, CD16, CD33, CD38 and HLADR and in a second staining antibodies used were anti-CD3, CD4, CD8, CD45RA, CD27, CD28, CD31 and CCR7. (A) Graphs indicate the percentage of total CD3+, CD3+CD4+ and CD3+CD8+ T cells. (B) FACS plots depict the gating strategy to measure the frequency of CD4+ and CD8+ T cells expressing HLADR in three representative patients (asymptomatic, mild and severe). Percentage of CD4+HLADR+ or CD8+HLADR+ T cells is shown in the relative graphs (at the first sample collected after diagnosis). (C) Pseudocolor plots show CD31 expression in CD4+ and CD8+ naïve T cells (CD3+CCR7+CD45RA+). CD31+ are recent thymic emigrants and CD31− are naïve T cells. Graphs show the percentage of CD31+ and CD31− T cells in all patients (at the first sample collected after diagnosis). (D) FACS plots show CD4+ or CD8+ central memory (CD3+CCR7+CD45RA−), effector memory (CD3+CCR7−CD45RA−) T cells and TEMRA (CD3+CCR7−CD45RA+) T cells. Scatter plots depict the percentage of CD4+ and CD8+ TEMRA (at the first sample collected after diagnosis). Median is shown as midline. Statistical significances were determined using unpaired, two-tailed Mann–Whitney U-tests. *p ≤ 0.05, **p < 0.01, ***p < 0.001.

