

Abstract
Dengue viruses (DENVs) are classified into four serotypes, each of which contains multiple genotypes. DENV genotypes introduced into the Americas over the past five decades have exhibited different rates and patterns of spatial dispersal. In order to understand factors underlying these patterns, we utilized a statistical framework that allows for the integration of ecological, socioeconomic, and air transport mobility data as predictors of viral diffusion while inferring the phylogeographic history. Predictors describing spatial diffusion based on several covariates were compared using a generalized linear model approach, where the support for each scenario and its contribution is estimated simultaneously from the data set. Although different predictors were identified for different serotypes, our analysis suggests that overall diffusion of DENV-1, -2, and -3 in the Americas was associated with airline traffic. The other significant predictors included human population size, the geographical distance between countries and between urban centers and the density of people living in urban environments.
Keywords: dengue virus, Bayesian phylogeography, hypothesis testing, spatial diffusion
1. Introduction
Dengue viruses (DENVs), the mosquito-borne etiologic agents of dengue disease, exist as four serotypes (DENV-1, -2, -3, and -4) and are endemic in over 100 countries situated primarily between the Tropics of Cancer and Capricorn. It is estimated that only about 20 per cent of DENV infections are clinically apparent, of which only a small proportion manifest as life-threatening severe dengue (Bhatt et al., 2013). Even the milder form of the disease can be highly debilitating, and with ∼2.5 billion people (or roughly 40 per cent of the global human population) at risk of infection (World Health Organization, 2009), the disease burden is very high.
Prior to 1977, only the ‘American subtype’ or Genotype III of DENV-2 had been documented in the Americas and outbreaks were sporadic, small and geographically restricted. Successive introductions of Asian genotypes of each of the four serotypes from about 1963 onwards precipitated a dramatic change in epidemic pattern, initially defined by the occurrence of much larger and wide spread epidemics, then an increase in incidence of severe dengue (dengue hemorrhagic fever/dengue shock syndrome; Nogueira et al., 1993; Pinheiro and Corber, 1997; Rico-Hesse et al., 1997; Gubler, 1998b; Carrington et al., 2005), a transition from hypoendemicity (local establishment and circulation of one serotype) to hyperendemicity (establishment and circulation of multiple serotypes), and shortening of the intra-epidemic periods.
Currently, dengue outbreaks occur annually in most tropical and subtropical countries of the Americas, often involving more than one serotype (Ramos-Castaneda et al., 2017; Pan American Health Organization, 2020b). A study conducted by Shephard et al. (2016) estimated that the aggregate annual total cost of dengue in the Americas for the period 2000–07 was US$2.1 billion, the majority of which was associated with productivity losses induced by non-fatal dengue cases. In 2019, 3.1 million cases of dengue fever were recorded in the Americas, a 20 per cent increase from the previous record high in 2015 (Pan American Health Organization, 2019). Only three of fifty-three countries and/or territories (i.e. Uruguay, continental Chile and Canada) are free of endemic DENV transmission (as of 2019; Pan American Health Organization, 2015, 2019).
The success of dengue in the tropical and subtropical Americas is a consequence of the widespread prevalence of the highly anthropophilic vector Aedes aegypti, which thrives in areas close to human habitation and remains unchecked due to the inadequacy of mosquito control programs. The very rapid expansion and establishment of each newly introduced serotype was possibly facilitated by rapid human population growth, socioeconomic changes, uncontrolled urbanization, and increased ease of human movement at the time. These factors will surely continue to influence epidemic behavior.
The recent introduction and immense impact of Ae. aegypti-vectored chikungunya virus (Campion, Weaver, and Lecuit, 2015; Sahadeo et al., 2015, 2017) and Zika virus (Dyer, 2015; Faria et al., 2016; Fauci & Morens, 2016; Gatherer & Kohl, 2016) on the Americas highlight the need for a better understanding of the role of these and other underlying factors in the establishment and spread of the Ae. aegypti-vectored viruses. In particular, a better understanding of the patterns of spread of these viruses is needed to inform monitoring and control strategies and further facilitate the development of models that might be used to predict the behavior of emerging mosquito-borne viruses.
Previous studies have investigated the evolutionary history and spatial diffusion of DENV (Bennett et al., 2006; Mendez et al., 2010; Bennett et al., 2010; Nunes et al., 2012; Drumond et al., 2013). Of these, only a few considered large-scale diffusion (i.e. amongst countries; Villabona-Arenas & Zanotto, 2011, 2013; Allicock et al., 2012). Work by Carrington et al. (2005) highlighted the importance of certain socioeconomic and cultural factors on the diffusion of the virus in the Americas; however, the relative lack of genetic information from the Caribbean islands made such large-scale analyses difficult to interpret (Carrington et al., 2005). Additionally, previous work from our lab and others have used various phylogeographic methods for investigating the movement of DENV (Villabona-Arenas & Zanotto, 2011, 2013; Allicock et al., 2012) including hypothesis testing (Nunes et al., 2014). However, no one has used hypothesis testing to investigate the factors driving intra-region viral diffusion over the Americas.
In this study, we use Bayesian phylogenetic techniques to reconstruct the long-term region wide transmission dynamics of individual DENV genotypes in the Americas and identify factors influencing patterns of spread. The inclusion of a much larger number of sequences from Caribbean islands (including fifty-four derived in this study) and the use of a rigorous statistical framework for hypothesis testing address some of the limitations of previous attempts (Carrington et al., 2005; Allicock et al., 2012).
2. Materials and methods
2.1 Virus isolation, reverse transcription polymerase chain reaction amplification, and sequencing
Two sets of confirmed DENV serum samples were collected. The first set included six DENV-1, nineteen DENV-2, five DENV-3, and four DENV-4 anonymized serum samples from nine Caribbean countries, which were obtained from the collection of the Caribbean Public Health Agency (CARPHA). The second set included twelve DENV-1 and eight DENV-4 serum samples collected from Trinidad Public Health Laboratory (TPHL) and Eric Williams Medical Sciences Complex (EWMSC). Viral RNA was extracted from 140 μl of serum using QIAamp Viral RNA Extraction Kits (Qiagen; Valencia, CA). For the first set, envelope (E) genes were then amplified in a two-step process as described previously (Allicock et al., 2012).Reverse transcription was performed using SuperScript III Reverse Transcriptase (Invitrogen, USA) and amplified by polymerase chain reaction (PCR) using Phusion DNA polymerase (New England Biolabs; Ipswich, MA), using primers designed for 2× coverage of the entire open reading frame. Primers and thermocycling conditions used were previously published (Allicock et al., 2012). Amplicons were visualized on a 2 per cent agarose gel and subsequently excised and purified using QIAquick Gel Extraction kit (Qiagen; Valencia, CA). Purified PCR amplicons were sequenced directly on an Applied Biosystems 3100 genetic analyzer. Sequences were assembled using Sequencher 4.5 (Gene Codes Corporation; Ann Arbor, MI) and were submitted to GenBank under the accession numbers shown in Table 1. For the second set, the extracted RNA samples were prepared for whole genome sequencing. After fragmentation of the RNA, the Illumina TruSeq RNA Sample Preparation kit v2 (Illumina Inc., San Diego, California, USA) was used for adapter ligation and amplification of the libraries, according to manufacturer’s instructions. For cluster formation of the library templates, the TruSeq PE Cluster Kit v3 (Illumina Inc., San Diego, California, USA) and the Illumina cBot workstation were used, also in accordance with the manufacturer’s instructions. Paired end 50 base sequencing was done on the Illumina HiSeq 1000 using the TruSeq SBS kit v3 (Illumina Inc.; San Diego, California, USA) at the Institute for Human Infections and Immunity and Department of Microbiology and Immunology, University of Texas Medical Branch, Galveston, Texas, USA. Base call conversion to sequence reads was performed using CASAVA-1.8.2. Reads were filtered for quality and adapter sequences were removed.
Table 1.
Dengue envelope gene sequences derived in this study according to year and location of isolation, serotypes, year, and accession number.
| Year | Serotype | Strain | Source | Location | Accession number |
|---|---|---|---|---|---|
| 2005 | 1 | 510562 | CARPHA | Belize | KU728183 |
| 2005 | 1 | 511207 | CARPHA | Belize | KU728184 |
| 2010 | 1 | 1003240 | CARPHA | Dominica | KU728187 |
| 2010 | 1 | 1003227 | CARPHA | Dominica | KU728186 |
| 2010 | 1 | 1013169 | CARPHA | Dominica | KU728188 |
| 2010 | 1 | 510536 | CARPHA | Belize | KU728185 |
| 2005 | 2 | 514633 | CARPHA | Suriname | KU728189 |
| 2005 | 2 | 514641 | CARPHA | Suriname | KU728190 |
| 2006 | 2 | 603616 | CARPHA | Suriname | KU728191 |
| 2006 | 2 | 609090 | CARPHA | Suriname | KU728192 |
| 2006 | 2 | 609654 | CARPHA | Suriname | KU728193 |
| 2008 | 2 | 810812 | CARPHA | British Virgin Islands | KU728201 |
| 2008 | 2 | 809127 | CARPHA | St. Lucia | KU728199 |
| 2008 | 2 | 810693 | CARPHA | British Virgin Islands | KU728202 |
| 2008 | 2 | 809122 | CARPHA | St. Lucia | KU728198 |
| 2008 | 2 | 807742 | CARPHA | Trinidad and Tobago | KU728194 |
| 2008 | 2 | 809119 | CARPHA | St. Lucia | KU728197 |
| 2008 | 2 | 810813 | CARPHA | British Virgin Islands | KU728203 |
| 2008 | 2 | 808715 | CARPHA | St. Lucia | KU728196 |
| 2008 | 2 | 810692 | CARPHA | British Virgin Islands | KU728200 |
| 2008 | 2 | 807832 | CARPHA | Trinidad and Tobago | KU728195 |
| 2010 | 2 | 1002794 | CARPHA | Grenada | KU728204 |
| 2010 | 2 | 1003004 | CARPHA | Grenada | KU728207 |
| 2010 | 2 | 1002795 | CARPHA | Grenada | KU728205 |
| 2010 | 2 | 1002985 | CARPHA | St. Vincent and the Grenadines | KU728206 |
| 2005 | 3 | 508133 | CARPHA | Suriname | KU728209 |
| 2005 | 3 | 508126 | CARPHA | Suriname | KU728208 |
| 2005 | 3 | 508134 | CARPHA | Suriname | KU728210 |
| 2008 | 3 | 810432 | CARPHA | St. Kitts and Nevis | KU728211 |
| 2008 | 3 | 810708 | CARPHA | St. Kitts and Nevis | KU728212 |
| 2006 | 4 | 609277 | CARPHA | Dominica | KU728213 |
| 2006 | 4 | 609284 | CARPHA | Dominica | KU728215 |
| 2006 | 4 | 609282 | CARPHA | Dominica | KU728214 |
| 2010 | 4 | 1000791 | CARPHA | Suriname | KU728216 |
| 2011 | 1 | NSH1108841 | TPHL | Trinidad and Tobago | MN244557 |
| 2011 | 1 | NSH1109383 | TPHL | Trinidad and Tobago | MN244560 |
| 2011 | 1 | NSH1109147 | TPHL | Trinidad and Tobago | MN244559 |
| 2012 | 1 | NSH1204480 | TPHL | Trinidad and Tobago | MN244562 |
| 2013 | 1 | NSH1309127 | TPHL | Trinidad and Tobago | MN244565 |
| 2013 | 1 | NSH1306199 | TPHL | Trinidad and Tobago | MN244564 |
| 2011 | 1 | NSH1109079 | TPHL | Trinidad and Tobago | MN244558 |
| 2012 | 1 | NSH1205002 | TPHL | Trinidad and Tobago | MN244563 |
| 2012 | 1 | NSH1202573 | TPHL | Trinidad and Tobago | MN244561 |
| 2013 | 1 | NSSF260913 | TPHL | Trinidad and Tobago | MN244566 |
| 2014 | 1 | NSEW030114 | EWMSC | Trinidad and Tobago | MN244555 |
| 2014 | 1 | NSEW060114 | EWMSC | Trinidad and Tobago | MN244556 |
| 2012 | 4 | NSH1202583 | TPHL | Trinidad and Tobago | MN244669 |
| 2013 | 4 | NSH1300161 | TPHL | Trinidad and Tobago | MN244670 |
| 2013 | 4 | NSH1300162 | TPHL | Trinidad and Tobago | MN244671 |
| 2013 | 4 | NSH1309045 | TPHL | Trinidad and Tobago | MN244672 |
| 2013 | 4 | NSH1309127 | TPHL | Trinidad and Tobago | MN244673 |
| 2013 | 4 | NSH1309188 | TPHL | Trinidad and Tobago | MN244674 |
| 2014 | 4 | NSH1400093 | TPHL | Trinidad and Tobago | MN244675 |
| 2014 | 4 | NSEW310114 | EWMSC | Trinidad and Tobago | MN244668 |
Contigs were assembled de novo using the AbySS software (Simpson et al., 2009) which were then checked using bowtie2 (Langmead and Salzberg, 2012), followed by visualization using the integrative genomics viewer (Robinson et al., 2011). To identify sequences of viral origin, the assembled contigs were queried against the GenBank/European Molecular Biology Laboratory Nucleotide Sequence Database/DNA Data Bank of Japan database using both the Basic Local Alignment Search Tool (BLAST; Boratyn et al., 2012), both BLASTN and BLASTX options.
2.2 DENV nucleotide sequence data sets
For each serotype, sequences for the newly generated isolates (Table 1) were combined with previously published envelope (E) gene sequences from GenBank. After the removal of sequences passaged more than three times, or duplicates, the sequences were aligned using the ClustalW algorithm (Thompson, Higgins, and Gibson, 1994) as implemented in Geneious 10.1.3 (https://www.geneious.com), and trimmed to a common length. Sequence genotypes were confirmed through maximum likelihood tree estimation using a genotype reference alignment (data not shown). All sequences were confirmed as non-recombinant using the Recombination Detection Program4 Beta 4.95 (Martin et al., 2015). To avoid over-representation of some countries, post-sub-sampling was done randomly so that there were no more than seven sequences per country per year. Temporal signal was assessed using TempEst v.1.5.3 (Rambaut et al., 2016). The resulting four data sets, representative of the main circulating genotypes in the Caribbean, represent thirty-six countries and a time period covering 1977–2018 (see Supplementary Table S1 for data set) are summarized in Table 2.
Table 2.
Summary descriptions of DENV E gene data sets.
| Serotype | Genotype | Year range | No. of countries represented | No. of taxa | Sequence size (bp) | Positiona |
|---|---|---|---|---|---|---|
| DENV-1 | V | 1977–2018 | 21 | 386 | 1,485 | 935–2,419 |
| DENV-2 | IIIb | 1981–2018 | 27 | 452 | 1,485 | 937–2,422 |
| DENV-3 | III | 1994–2017 | 26 | 307 | 1,479 | 935–2,413 |
| DENV-4 | II | 1981–2016 | 20 | 236 | 1,485 | 939–2,423 |
2.3 Evolutionary and phylogeographic analysis of DENV
To reconstruct the temporal and spatial diffusion of DENV serotypes in the region, discrete phylogeographic analyses were performed for each of the circulating DENV serotypes. Each taxon in the data sets was associated with a character state based on its country/subregion of origin. Subregions were defined by the CARPHA and the World Health Organization (Pan American Health Organization, 2020a) for epidemiological reporting purposes, and consider both geographic location and sociohistorical links (see Fig. 1):
Figure 1.

Map of the Americas. Location of the countries included in the study, from South America, the Caribbean, and Central America.
Andean region (AND): Bolivia, Colombia, Ecuador, Peru, and Venezuela.
Central America and Mexico (CAM): Belize, Costa Rica, El Salvador, Honduras, Mexico, Nicaragua, and Panama (note: as Mexico is the only North American country considered in this study, for convenience the term Central America is used in reference to ‘Central America and Mexico’).
English, French, and Dutch Caribbean (EFD): Antigua and Barbuda, Aruba, Bahamas, Barbados, British Virgin Islands, Dominica, French Guiana, Grenada, Guadeloupe, Jamaica, Martinique, Montserrat, St. Kitts and Nevis, St. Lucia, Suriname, Trinidad and Tobago.
Hispanic Caribbean (HIC): Cuba, Dominican Republic, and Puerto Rico.
Southern Cone (SAC): Argentina, Brazil, and Paraguay.
Phylogeographic analyses were carried out using a general time reversible nucleotide substitution model (Tavare et al., 1997) with four discrete gamma rate categories (Yang, 1996) as recommended by MODELTEST v3.7 (Posada and Crandall, 1998). The best fitting coalescent process prior used for DENV-1 was Bayesian Skyline (Drummond et al., 2005) and for DENV-2 to -4 the Constant (Kingman, 1982) along with an uncorrelated lognormal clock model (A. J. Drummond and Rambaut, 2007) using BEAST v1.10.4. software package (Suchard et al., 2018). This selection was based on the estimated marginal likelihood using Path sampling and stepping stone sampling (Baele, Lemey, and Vansteelandt, 2013).
To ensure convergence and appropriate effective sampling sizes for the parameters (> 200), a Markov chain Monte Carlo was run for 100–150 million generations, with a 10 per cent burn-in period that was more than adequate to achieve stationarity. The program Tracer v1.7.1 (Rambaut et al., 2018) was used to ensure stationarity was achieved. The software program TreeAnnotator v1.10.4 was used to summarize the posterior tree distribution and FigTree v1.4.4. to visualize the annotated maximum clade credibility (MCC) trees.
2.4 Identifying factors underlying patterns of DENV diffusion
A generalized linear model (GLM) approach developed as an extension to the Bayesian inference framework in BEAST framework v1.10.4 (Drummond et al., 2012; Lemey et al., 2012) was used to test the contributions of potential predictors to spatial diffusion. The method allows for the reconstruction of phylogenetic history and spatiotemporal diffusion (Lemey et al., 2010), while modeling this diffusion process as a function of a number of potential predictors for which the support and contribution is estimated. As support we consider the inclusion probability for a predictor, which is the posterior expectation of a Boolean indicator variable that determines whether a predictor is included in or excluded from the model. The contribution is represented by the effect size (or GLM coefficient) for each predictor on a log scale. Bayes factors (BFs) were calculated to determine the support for the inclusion of each predictor in the model, and predictor contributions are reported as effect sizes conditional on the effect being included in the model.
Predictors investigated fell into the following categories:
‘GeoDistance’ represents the log great circle distance between centroids of each pair of countries.
‘PopDistance’ represents log great-circle distance between the largest and closest population centers between each pair of countries. Most Caribbean islands only have one main city. For the larger countries, this was interpreted as the two closest cities above a certain size relative to the population size (see Supplementary Table S2 for the locations used).
-
Airline Passenger Flux: We obtained Data for both of these predictors from the OAG Max database (http://www.oag.com/) and represent 1982, 1987, 1992, 1997, 2002, 2007, and 2012.
Total Air Frequency—total number of flights available between each pair of countries from the years listed above.
Total Air Capacity—total number of seats available on flights between each pair of countries from the years listed above.
Human Population Size (PopSize): We obtained population size estimates for each country from the Central Intelligence Agency: The World Factbook (Central Intelligence Agency, 2014). Origin and destination population sizes were included as separate predictors, identified as ‘Origin PopSize’ and ‘Destination PopSize’, respectively.
-
Level of Urbanization: We obtained data from the United Nations Development Programme: Human Development Reports (2014) which looked at two different predictors related to urbanization.
The percentage of the population of a given country living in urban areas between a pair of locations (United Nations Development Programme, 2014a). These data rely on national definitions for what constitutes a city or metropolitan area. These were included as the predictors ‘origin urbanization (%)’ and ‘destination urbanization (%)’.
A calculation of the percentage of total land area covered by forests in a given country in 2012. These were included as separate predictors, ‘Origin Forest’ and ‘Destination Forest’.
Level of Human Development: We obtained data from United Nations Development Programme: Human Development Reports (United Nations Development Programme, 2014b) for the Human Development Index (HDI). These were included as separate predictors, ‘Origin HDI’ and ‘Destination HDI’.
Sample size: To assess the impact of heterogeneous sampling, we included the number of sequences between each pair of countries as a predictor. These data were included as separate predictors, ‘Origin Sample Size’ and ‘Destination Sample Size’.
3. Results
3.1 Evolutionary history and phylogeography of DENV-1 to -4 in the Americas
Figures 2–5 show the MCC phylogenies inferred from the four data sets in which sequences were tagged according to the country from which they originated. The estimated DENV phylogenies demonstrate spatial subdivision to different degrees, as evidenced by the clustering of sequences into well-supported clades defined by country. This spatial subdivision was more evident at the subregional level (Supplementary Figs. S1–4). The inferred rates of evolution can be seen in Table 3.
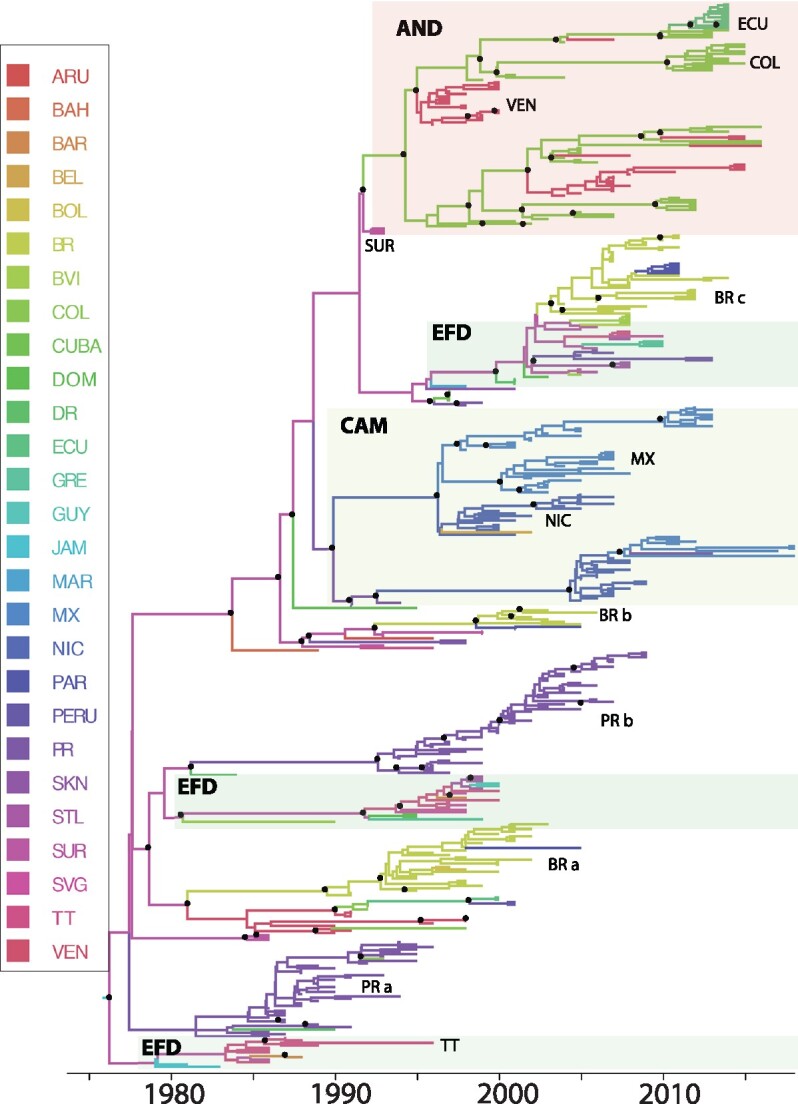
Figure 2.

Bayesian MCC tree summarized for the DENV-1 Genotype V data set (n = 386). Terminal branches are colored according to the location of origin of the sequence at the tip, with colors as indicated in the key. Likewise, internal branches are colored according to the most probable (modal) location of their parental node inferred using a discrete phylogeographic diffusion model. Posterior clade probability percentages for nodes > 0.90 are indicated by black nodes. Location abbreviations are as follows: ANT, Antigua & Barbuda; ARG, Argentina; ARU, Aruba; BAH, Bahamas; BAR, Barbados; VG, British Virgin Islands; BEL, Belize; BOL, Bolivia; BRA, Brazil; COL, Colombia; CR, Costa Rica; DR, Dominican Republic; DOM, Dominica; ECU, Ecuador; FGA, French Guiana; GRE, Grenada; GUY, Guyana; GUA, Guadeloupe; HON, Honduras; JAM, Jamaica; MAR, Martinique; MON, Montserrat; MEX, Mexico; NIC, Nicaragua; PAR, Paraguay; PR, Puerto Rico; PAN, Panama; SAL, El Salvador; SKN, St. Kitts & Nevis; SLU, St. Lucia; SVG, St. Vincent & the Grenadines; SUR, Suriname; TT, Trinidad & Tobago; VEN, Venezuela.
Table 3.
Rates of nucleotide substitution, location, and year the most recent ancestor existed for DENV-1 to -4 data sets.
| DENV serotype (genotype) | Mean rate of nucleotide substitution/site/year |
MRCAa (year) |
Root state location (posterior probability) | ||
|---|---|---|---|---|---|
| Mean | 95% HPDb | Mean | 95% HPDb | ||
| 1 (V) | 7.17 × 10⁻⁴ | 6.39 × 10⁻⁴, 8.02 × 10⁻⁴ | 1973 | 1972–75 | Grenada (0.98) |
| 2 (IIIb) | 8.14 × 10⁻⁴ | 7.24 × 10⁻⁴, 8.98 × 10⁻⁴ | 1975 | 1970–78 | Jamaica (0.52) |
| 3 (III) | 8.24 × 10⁻⁴ | 7.09 × 10⁻⁴, 9.44 × 10⁻⁴ | 1982 | 1975–88 | Nicaragua (0.74) |
| 4 (II) | 1.09 × 10⁻³ | 9.52 × 10⁻⁴, 1.24 × 10⁻³ | 1976 | 1972–80 | Puerto Rico (0.79) |
Most recent common ancestor.
Highest probability density.
The DENV-1 (Genotype V) phylogeny (Fig. 2) The basal clade is comprised of older sequences from Grenada, Trinidad and Tobago and Barbados (EFD), Puerto Rico (PR a), and Mexico (MX a) which circulated from 1977 to 2000. It also includes a monophyletic lineage comprised of newer sequences from Brazil (BR a, 2002–13), along with three sequences from Argentina and one sequence from the British Virgin Islands.
The majority of the other sequences clustered together in the second major monophyletic clade, with sequences from Grenada, the Bahamas, Suriname, French Guiana and Trinidad and Tobago (EFD) falling in the basal position. This clade also includes sequences from Brazil (BR b), Venezuela, Colombia, and Nicaragua. Newer sequences from Trinidad and Tobago, Dominica and Barbados were found dispersed throughout a large monophyletic grouping, comprising mostly of Colombian and Venezuelan sequences (AND). There is evidence of co-circulation of distinct lineages, with one lineage persisting and expanding, whereas the other becomes extinct (posterior probability > 0.90 at the internal node) in some countries, for example, Grenada in 1977–81 (labeled as GREa and GREb in Fig. 2), Puerto Rico during 1992–96 (PRa and PRb), suggesting multiple introductions of this genotype into several of these countries.
Countries from EFD were basal in this phylogeny, indicative of more gene flow from this subregion upon introduction around 1973 (95% HPD 1972–75). The overall pattern of this phylogeny is characterized by clear subdivision by subregion, with initial DENV-1 diffusion from the Caribbean islands (EFD and/or HIC, which I will refer to as ‘island’) to the South and/or Central America (SAC, AND, CAM, which I will refer to as ‘mainland’), which then acted as an occasional source of gene flow back to the islands. Based on estimated root state probabilities, the most recent common ancestor for the DENV-1 sequences represented in the data set is estimated to have existed in Grenada (root state probability = 0.98 versus the Bahamas (0.01)).
In the DENV-2 (Genotype IIIb) phylogeny (see Fig. 3), sequences sampled from the first outbreak in Jamaica, Suriname, and Barbados (EFD) fell in the basal position, with all but one of the sequences represented were sampled 1981–87. Within this grouping there were also sequences from Trinidad and Tobago sampled 1986–96, indicating that this lineage persisted in the EFD for at least 14 years before extinction. There is evidence of multiple distinct lineages co-circulating in a country, one of which persists and expands, while the other becomes extinct. The more obvious examples include Puerto Rico (PRa and PRb), Trinidad and Tobago (EFD clades) and Brazil (BRa, BRb, and BRc). Like DENV-1, the most recent common was estimated to have existed in EFD, represented by Jamaica or Suriname (root state probability = 0.52 and 0.44) in 1975 (95% HPD 1970–78). The topology of the phylogeny exhibited patterns of spatial subdivision, as the sequences clustered based on location at the subregion (see Supplementary Fig. S2) and country levels.
Figure 3.
Bayesian MCC tree summarized for the DENV-2 Genotype IIIb data set (n = 452). Terminal branches are colored according to the location of origin of the sequence at the tip, with colors as indicated in the key. Likewise, internal branches are colored according to the most probable (modal) location of their parental node inferred using a discrete phylogeographic diffusion model. Posterior clade probability percentages for nodes > 0.90 are indicated by black nodes. Location abbreviations are as follows: ANT, Antigua & Barbuda; ARG, Argentina; ARU, Aruba; BAH, Bahamas; BAR, Barbados; BVI, British Virgin Islands; BEL, Belize; BOL, Bolivia; BRA, Brazil; COL, Colombia; CR, Costa Rica; DR, Dominican Republic; DOM, Dominica; ECU, Ecuador; FGA, French Guiana; GRE, Grenada; GUY, Guyana; GUA, Guadeloupe; HON, Honduras; JAM- Jamaica; MAR, Martinique; MON, Montserrat; MEX, Mexico; NIC, Nicaragua; PAR, Paraguay; PR, Puerto Rico; PAN, Panama; SAL, El Salvador; SKN, St. Kitts & Nevis; SLU, St. Lucia; SVG, St. Vincent & the Grenadines; SUR, Suriname; TT, Trinidad & Tobago; VEN, Venezuela.
The DENV-3 (Genotype III; see Fig. 4) phylogeny is separated into two monophyletic clades based on posterior probability (I and II), which are estimated to have arisen from a common ancestor that existed in Nicaragua (root state probability = 0.74, Venezuela = 0.10) in 1982 (95% HPD 1975–88). The basal position of the phylogeny is comprised of sequences from the original outbreak in Panama and surrounding countries (CAM) along with sequences from Mexico, Venezuela, and Colombia. This clade also included five sequences from St. Kitts and Nevis, Jamaica and Grenada, likely due to one-off introductions of this strain to these countries. Co-circulation of the difference lineages were observed in Puerto Rico between 1999 and 2006 (PRa and PRb) and Colombia from 2004 to 2007 (COLa and COLb). The majority of the other EFD sequences were located in one well-supported grouping.
Figure 4.

Bayesian MCC tree summarized for the DENV-3 Genotype III data set (n = 307). Terminal branches are colored according to the location of origin of the sequence at the tip, with colors as indicated in the key. Likewise, internal branches are colored according to the most probable (modal) location of their parental node inferred using a discrete phylogeographic diffusion model. Posterior clade probability percentages for nodes >0.90 are indicated by black nodes. Location abbreviations are as follows: ANT, Antigua & Barbuda; ARG, Argentina; ARU, Aruba; BAH, Bahamas; BAR, Barbados; BVI, British Virgin Islands; BEL, Belize; BOL, Bolivia; BRA, Brazil; COL, Colombia; CR, Costa Rica; DR, Dominican Republic; DOM, Dominica; ECU, Ecuador; FGA, French Guiana; GRE, Grenada; GUY, Guyana; GUA, Guadeloupe; HON, Honduras; JAM, Jamaica; MAR, Martinique; MON, Montserrat; MEX, Mexico; NIC, Nicaragua; PAR, Paraguay; PR, Puerto Rico; PAN, Panama; SAL, El Salvador; SKN, St. Kitts & Nevis; SLU, St. Lucia; SVG, St. Vincent & the Grenadines; SUR, Suriname; TT, Trinidad & Tobago; VEN, Venezuela.
The topology of the MCC phylogeny for DENV-4 Genotype II (see Fig. 5) revealed a temporal pattern, unlike the other serotypes. This genotype circulating in this region is estimated to have diverged from a common ancestor that existed in 1976 (95% HPD 1972–80) located in Puerto Rico (root state probability = 0.79). The base of the phylogeny is comprised of sequences from all subregions, mostly from CAM (Honduras, Mexico, and El Salvador) and EFD (Trinidad and Tobago, Jamaica, Suriname, and Dominica), sampled between 1981 and 2000. The next clade is comprised of sequences from Puerto Rico, where this lineage persisted for 29 years (1985–2014) with sporadic introductions to various EFD islands. This genotype then spread to the AND in 1995, then was reintroduced to the SAC in 2011.
Figure 5.

Bayesian MCC tree summarized for DENV-4 Genotype II data set (n = 236). Terminal branches are colored according to the location of origin of the sequence at the tip, with colors as indicated in the key. Likewise, internal branches are colored according to the most probable (modal) location of their parental node inferred using a discrete phylogeographic diffusion model. Posterior clade probability percentages for nodes > 0.90 are indicated by black nodes. Location abbreviations are as follows: ANT, Antigua & Barbuda; ARG, Argentina; ARU, Aruba; BAH, Bahamas; BAR, Barbados; BVI, British Virgin Islands; BEL, Belize; BOL, Bolivia; BRA, Brazil; COL, Colombia; CR, Costa Rica; DR, Dominican Republic; DOM, Dominica; ECU, Ecuador; FGA, French Guiana; GRE, Grenada; GUY, Guyana; GUA, Guadeloupe; HON, Honduras; JAM, Jamaica; MAR, Martinique; MON, Montserrat; MEX, Mexico; NIC, Nicaragua; PAR, Paraguay; PR, Puerto Rico; PAN, Panama; SAL, El Salvador; SKN, St. Kitts & Nevis; SLU, St. Lucia; SVG, St. Vincent & the Grenadines; SUR, Suriname; TT, Trinidad & Tobago; VEN, Venezuela.
3.2 Factors underlying patterns of DENV diffusion
We compared nine potential predictors of DENV diffusion using a GLM approach, with the results summarized in Fig. 6. Predictors were identified as significant based on the BF support, where BF > 3 = positive, >20 = strong, and >150 very strong. None of the predictors contributed to the spatial diffusion of DENV-4 in the region and as such will not be discussed further. Overall, there was consistent and overwhelming support for the frequency of flights driving the rate of spatial diffusion of the virus in the Americas for DENV-1, DENV-2, and DENV-3 (gene flow and AirFrequency are positively correlated; BFs ≥ 999 with positive mean conditional effect size). The number of airline seats (Total Air Capacity) was also included as a predictor for DENV-2.
Figure 6.

Predictors of DENV-1 to -4 diffusion. The contribution of each predictor (i.e. the conditional effect size) when included in the model (β|δ = 1), is represented by the mean and credible intervals of the GLM coefficients on a log scale. Inclusion probabilities are represented as BFs (BF > 3 = positive, >20 = strong, >150 very strong). Posterior mean and 95% Bayesian credible interval are represented as a black dot and line respectively. Another probability measure of inclusion or exclusion of the predictor is represented by indicator variable δ (rightmost panel).
Other than AirFrequency, the predictors contributing to the gene flow differed across the serotypes. Distance (GeoDistance) was identified as a significant predictor for DENV-1 and -3 with a negative effect size, indicating more intense diffusion among countries that are in close proximity. In the case of population size, the intensity of gene flow was positively correlated with the population size of the country of origin. Population size was identified as a predictor for DENV-1 and -3, with more gene flow into countries with larger populations, and for DENV-3, both from and to larger populations. The percentage of the population living in urban populations in the origin country was negatively correlated with gene flow, indicating that gene flow is more intense from less urbanized countries for DENV-2. The number of location transitions estimated using the DENV-2 data set was influenced by the sample size for the countries of origin, indicating that sample size may play a role in the inclusion/exclusion of the other predictors (Lemey et al., 2014).
4. Discussion
The invasion of the Americas by DENV serotypes and/or genotypes that were previously unknown in the region is well documented (Pinheiro & Corber, 1997; Rico-Hesse et al., 1997; Gubler, 1998b; Carrington et al., 2005; Bennett et al., 2010; Mendez et al., 2010). The genotypes of DENV-1 to -4 analyzed in this study have now been in the region for 26–43 years (depending on the serotype) and were the most prevalent during the time period represented by the data sets used in this study. Other genotypes have circulated in the Caribbean (DENV-2 IIIb and V; Foster et al., 2004); however this phenomenon is observed more in the larger countries (DENV-II Genotypes I and III in Brazil; Vilela et al., 2010and DENV-3 Genotypes III and V in Columbia and Brazil among others; Aquino et al., 2009; Mendez et al., 2010).
Although evidence suggests that DENV-1, -2, and -4 entered the Americas via the Caribbean islands (Pan American Health Organization, 1979; Gubler, 1998a; Kouri et al., 1989), both epidemiological data and our GLM analysis indicate that DENV-3 was introduced to the region via the mainland (South or Central America; Centers for Disease Control and Prevention, 1995). The contribution of larger population sizes to gene flow both in the origin and destination of the virus also supports the introduction of DENV-3 Genotype III via the mainland. The larger human populations on the mainland and comparatively unhindered gene flow (i.e. compared with movement among islands, where the sea presents a physical barrier), may account for the more explosive outbreak than observed for the other serotypes.
The DENV-1, -2, and -3 phylogenies have similar topologies, characterized by the co-circulation of different lineages in some countries like Puerto Rico, Venezuela, and spatial subdivision. The extent of spatial subdivision is more evident when sequences were assigned to subregions (which consider both geography and historical links) than when assigned to countries. It is however possible that the longer persistence of lineages in these countries compared with others are artifacts reflecting the more thorough surveillance systems and sequencing efforts (Gubler, 1987).
Air traffic, and more specifically the number of scheduled flights between countries, was identified as a major determinant of DENV diffusion (except in the case of DENV-4, for which none of the predictors was significant). The importance of air transportation is not surprising given that the distances between Caribbean islands, and between the islands and the mainland, are well beyond the range of the vector, and that air travel is the main mechanism for human movement between islands. Interestingly, the number of scheduled flights was the predictor and not the total number of available seats. This is consistent with our previous study (Allicock et al., 2012), where only seat capacity was used as a proxy for air traffic and no correlation was found. Nunes et al. (2014) also found that the number of scheduled flights between regions within Brazil was a predictor of DENV diffusion but did not consider seat capacity. Tian et al. (2017) identified the contribution of air travel to the diffusion of the DENV using passenger flow data. One explanation for the failure of total seat capacity to predict gene flow in our DENV-1 and -3 data sets is that airplanes do not always fly at full capacity. Also, seat capacity gives an indication of the total number of humans sampled from a country, whereas the frequency of flights relates to how often the human population is sampled. Since DENV is seasonal (incidence is much higher during the rainy season months) and may be absent in a given country in a given year, an air traffic model that reflects the frequency at which a given country is sampled (Total Air Frequency) might reasonably be expected to outperform one that reflects the size of the sample (Total Air Capacity).
Distance between countries was identified as a predictor of intensity of DENV diffusion between pairs of countries for DENV-1 and -3 with more intense gene flow between nearby countries. This was the case when proximity was represented by the distances between the centroids of countries but not when the distances between nearby large population centers were used. The latter (PopDistance predictor) was included in recognition of the fact that the human populations are not evenly distributed within countries; however, it was not a contributor. Other geographic heterogeneity (mountain regions, rivers, etc.) and cultural confounders can affect the success of this predictor, but these were not taken into account. This meant that the closest and largest population centers between two countries of the Americas might be an unsuitable predictor between certain countries, especially on the mainland, and between HIC and other Caribbean Islands. GeoDistance may therefore be the better predictor because it effectively averages across these heterogeneities.
Human population size was identified as an important driver of DENV-1 and -3 diffusion. For DENV-1 the population size of the origin country. More intense gene flow into larger populations is consistent with a gravity model where larger populations act as ‘sinks’ for DENV from smaller populations. DENV-1 was first introduced to a Caribbean island (with a small population) which had stronger connections to other island states (EFD) than to the mainland countries where populations are much larger. This gravity model of DENV diffusion is also evident by the inverse relationship between rate of diffusion and the level of urbanization of origin countries observed for DENV-2.
The four DENV serotypes all use the same human host and Ae. aegypti vector so two obvious questions arising from this study are 1) why were no predictors identified for DENV-4 and 2) why (with the exception of air traffic) were the same predictors not consistently identified across the other three serotypes? An important difference between the DENV-4 data set and those for the other serotypes is the predominance of Puerto Rican sequences. The number of sequences available varied widely across the countries within this region. To avoid underrepresenting or over-representing discrete locations, post-sub-sampling was necessary (Lemey et al., 2012; Magee and Scotch, 2018) so the number of samples for each country was limited to no more than seven per year. However, the number of years in which Puerto Rico is represented in the DENV-4 data set (n = 16) is higher than for other countries (n = 1–8), which meant that within-country dynamics may not have been sampled for some countries and any inferences may be influenced by this imbalance.
With regards to the variation among DENV-1, -2, and -3 predictors, the overall diffusion pattern described by each serotype might be strongly influenced by the environment into which each virus was first introduced (e.g. a small, comparably isolated, island population versus a larger, mainland population with road links to neighboring countries), as well as the immune landscape at that location at the time of introduction and at each subsequent destination. DENV infection with a given serotype gives rise to high-titer neutralizing antibodies that confer life-long immunity to the infecting serotype, immunity to other serotypes is short-lived (Reich et al., 2013), which adds to the complexity of the immune landscape. Additionally, sub-neutralizing antibodies arising from an infection can enhance subsequent heterotypic DENV infections (Dejnirattisai et al., 2010) and there is evidence that antibodies arising from infection with closely related flaviviruses (e.g. Zika virus) may modulate DENV infection (Calisher et al., 1989). Thus, at any given time, the prevalence and type of immunity at each location would have been shaped by which serotypes were previously in circulation at that location and the length of time since the last outbreak.
The data informing the priors used (airline traffic, population size, etc.) are an important limitation to of the hypothesis testing analyses. These data were selected from a single-time point, while the genetic data spanned 26–43 years depending on the serotype. This would of course only affect those proxies that change over time (For example, distance would be unaffected). The impact would also be dependent on the magnitude of change during the time frame under investigation. For example, while human population size, urban densities, per cent forested areas, and HDI might be relatively stable or change very gradually, airline traffic has changed significantly, both in frequency and the connectivity between countries. Future studies can include the utilization of the epoch model (Goode et al., 2008; Bielejec et al., 2014 in the investigation of diffusion factors, as it allows different rate matrices to be specified for different time periods.
In conclusion, the strongest and most consistent predictor for rates of DENV movement between pairs of countries within the Americas is the frequency of air traffic between those countries. Human population size, the distance between these countries, the percentage of people living in urban environments and HDI were also predictive but were not consistent across serotypes and may reflect complex interactions among predictors and/or location-specific conditions not captured by the predictors tested.
Data availability
All sequences derived in this study are available at GenBank accession numbers KU728183–KU728216 and MN244555–MN244675. Phylogenetic MCC tree files are available at doi: 10.17632/rw6k9phdjz.1.
Supplementary Material
Acknowledgements
The authors would like to acknowledge the CARPHA and TPHL for providing the sera included in the study.
Funding
This work was supported by grants from the National Institute of Allergy and Infectious Diseases of the National Institutes of Health under award number R01AI153433 to A.J.A., and The University of the West Indies (UWI) Research Development Impact Fund to N.S., O.M.A., and C.V.F.C.
Conflict of interest: None declared.
Supplementary data
Supplementary data are available at Virus Evolution online.
Contributor Information
Orchid M Allicock, Department of Preclinical Sciences, Faculty of Medical Sciences, University of the West Indies, St. Augustine, Trinidad and Tobago; Center for Infection and Immunity, Mailman School of Public Health, Columbia University, New York, NY 10032, USA.
Nikita Sahadeo, Department of Preclinical Sciences, Faculty of Medical Sciences, University of the West Indies, St. Augustine, Trinidad and Tobago.
Philippe Lemey, KU Leuven, Department of Microbiology, Immunology and Transplantation, Rega Institute for Medical Research, Laboratory for Clinical and Epidemiological Virology, Leuven, Belgium.
Albert J Auguste, Department of Entomology, Fralin Life Science Institute, Virginia Polytechnic Institute and State University, Blacksburg, VA 24061, USA.
Marc A Suchard, Department of Biomathematics, David Geffen School of Medicine, University of California Los Angeles, Los Angeles, CA 90095, USA; Department of Bio statistics, Fielding School of Public Health, University of California, Los Angeles, CA, USA; Department of Human Genetics, David Geffen School of Medicine, University of California Los Angeles, Los Angeles, CA 90095, USA.
Andrew Rambaut, Institute of Evolutionary Biology, School of Biological Sciences, University of Edinburgh, Charlotte Auerbach Road, The Kings Buildings, Edinburgh, EH9 3FL, UK.
Christine V F Carrington, Department of Preclinical Sciences, Faculty of Medical Sciences, University of the West Indies, St. Augustine, Trinidad and Tobago.
References
- Allicock O. M et al. (2012) ‘Phylogeography and Population Dynamics of Dengue Viruses in the Americas’, Molecular Biology and Evolution, 29: 1533–43. [DOI] [PMC free article] [PubMed] [Google Scholar]
- Aquino V. H. et al. (2009) ‘New Genotype of Dengue Type 3 Virus Circulating in Brazil and Colombia Showed a Close Relationship to Old Asian Viruses’, PLoS One, 4: e7299. [DOI] [PMC free article] [PubMed] [Google Scholar]
- Baele G., Lemey P., Vansteelandt S. (2013) ‘Make the Most of Your Samples: Bayes Factor Estimators for High-Dimensional Models of Sequence Evolution’, BMC Bioinformatics, 14: 85. [DOI] [PMC free article] [PubMed] [Google Scholar]
- Bennett S. N. (2006) ‘Molecular Evolution of Dengue 2 Virus in Puerto Rico: positive Selection in the Viral Envelope Accompanies Clade Reintroduction’, Journal of General Virology, 87: 885–93. [DOI] [PubMed] [Google Scholar]
- Bennett S. N et al. (2010) ‘Epidemic Dynamics Revealed in Dengue Evolution’, Molecular Biology and Evolution, 27: 811–8. [DOI] [PMC free article] [PubMed] [Google Scholar]
- Bhatt S. et al. (2013) ‘The Global Distribution and Burden of Dengue’, Nature, 496: 504–7. [DOI] [PMC free article] [PubMed] [Google Scholar]
- Bielejec F et al. (2014) ‘Inferring Heterogeneous Evolutionary Processes through Time: From Sequence Substitution to Phylogeography’, Systematic Biology, 63: 493. [DOI] [PMC free article] [PubMed] [Google Scholar]
- Boratyn G. M. et al. (2012) ‘Domain Enhanced Lookup Time Accelerated BLAST’, Biology Direct, 7: 12. [DOI] [PMC free article] [PubMed] [Google Scholar]
- Calisher C. H. et al. (1989) ‘Antigenic Relationships between Flaviviruses as Determined by Cross-Neutralization Tests with Polyclonal Antisera’, Journal of General Virology, 70: 37–43. [DOI] [PubMed] [Google Scholar]
- Campion E. W., Weaver S. C., Lecuit M. (2015) ‘Chikungunya Virus and the Global Spread of a Mosquito-Borne Disease’, New England Journal of Medicine, 372: 1231–9. [DOI] [PubMed] [Google Scholar]
- Carrington C. V. et al. (2005) ‘Invasion and Maintenance of Dengue Virus Type 2 and Type 4 in the Americas’, Journal of Virology, 79: 14680–7. [DOI] [PMC free article] [PubMed] [Google Scholar]
- Centers for Disease Control and Prevention (CDC). (1995). Dengue type 3 infection--Nicaragua and Panama, October–November 1994. MMWR. Morbidity and Mortality Weekly Report, 44, 21. [PubMed] [Google Scholar]
- Central Intelligence Agency. (2014). The World Factbook [Internet]. <https://www.cia.gov/library/publications/the-world-factbook/> accessed 9 September 2014.
- Dejnirattisai W. et al. (2010) ‘Cross-Reacting Antibodies Enhance Dengue Virus Infection in Humans’, Science, 328: 745–8. [DOI] [PMC free article] [PubMed] [Google Scholar]
- Drummond A. J., Rambaut A. (2007) ‘BEAST: Bayesian Evolutionary Analysis by Sampling Trees’, BMC Evolutionary Biology, 7: 214. [DOI] [PMC free article] [PubMed] [Google Scholar]
- Drummond A. J. et al. (2005) ‘Bayesian Coalescent Inference of past Population Dynamics from Molecular Sequences’, Molecular Biology and Evolution, 22: 1185–92. [DOI] [PubMed] [Google Scholar]
- Drummond A. J. et al. (2012) ‘Bayesian Phylogenetics with BEAUti and the BEAST 1.7’, Molecular Biology and Evolution, 29: 1969–73. [DOI] [PMC free article] [PubMed] [Google Scholar]
- Drumond B. P et al. (2013) ‘Circulation of Different Lineages of Dengue Virus 2, Genotype American/asian in Brazil: Dynamics and Molecular and Phylogenetic Characterization’, PLoS ONE, 8: e59422. [DOI] [PMC free article] [PubMed] [Google Scholar]
- Dyer O. (2015). ‘Zika Virus Spreads Across Americas as Concerns Mount Over Birth Defects’, British Medical Journal, 351, h6983. [DOI] [PubMed] [Google Scholar]
- Faria N. R. et al. (2016) ‘Zika Virus in the Americas: Early Epidemiological and Genetic Findings’, Science, 352: 345–9. [DOI] [PMC free article] [PubMed] [Google Scholar]
- Fauci A. S., Morens D. M. (2016) ‘Zika Virus in the Americas–yet Another Arbovirus Threat’, New England Journal of Medicine, 374: 601–4. [DOI] [PubMed] [Google Scholar]
- Foster J. E. et al. (2004) ‘Phylogeography and Molecular Evolution of Dengue 2 in the Caribbean Basin, 1981-2000’, Virology, 324: 48–59. [DOI] [PubMed] [Google Scholar]
- Gatherer D., Kohl A. (2016) ‘Zika Virus: A Previously Slow Pandemic Spreads Rapidly through the Americas’, Journal of General Virology, 97: 269–73. [DOI] [PubMed] [Google Scholar]
- Goode M., GuindonS., and Rodrigo A. (2008) ‘Modelling the Evolution of Protein Coding Sequences Sampled from Measurably Evolving Populations. In Genome Informatics’, Genome Informatics Series, 21: 150–64. [PubMed] [Google Scholar]
- Gubler D. J. (1987) ‘Dengue and Dengue Hemorrhagic Fever in the Americas’, Puerto Rican Health Sciences, 6: 107–11. [PubMed] [Google Scholar]
- Gubler D. J. (1998. a) ‘Dengue and Dengue Hemorrhagic Fever’, Clinical Microbiology Reviews, 11: 480–96. [DOI] [PMC free article] [PubMed] [Google Scholar]
- Gubler D. J. (1998. b) ‘The Global Pandemic of Dengue/Dengue Haemorrhagic Fever: Current Status and Prospects for the Future’, Annals of the Academy of Medicine, Singapore, 27: 227–34. [PubMed] [Google Scholar]
- Kingman J. F. (1982) ‘The Coalescent’, Stochastic Processes and Their Applications, 13: 235–48. [Google Scholar]
- Kouri G. P. et al. (1989) ‘Dengue Haemorrhagic Fever/Dengue Shock Syndrome: Lessons from the Cuban Epidemic, 1981’, Bulletin of the World Health Organization, 67: 375–80. [PMC free article] [PubMed] [Google Scholar]
- Langmead B., Salzberg S. L. (2012) ‘Fast Gapped-Read Alignment with Bowtie 2’, Nature Methods, 9: 357–9. [DOI] [PMC free article] [PubMed] [Google Scholar]
- Lemey P. et al. (2010) ‘Phylogeography Takes a Relaxed Random Walk in Continuous Space and Time’, Molecular Biology and Evolution, 27: 1877–85. [DOI] [PMC free article] [PubMed] [Google Scholar]
- Lemey P. et al. (2012). ‘The Seasonal Flight of Influenza: A Unified Framework for Spatiotemporal Hypothesis Testing’, arXiv: Populations and Evolution, 1210.5877v1.
- Lemey P. et al. (2014) ‘Unifying Viral Genetics and Human Transportation Data to Predict the Global Transmission Dynamics of Human Influenza H3N2’, PLoS Pathogens, 10: e1003932. [DOI] [PMC free article] [PubMed] [Google Scholar]
- Magee D., Scotch M. (2018) ‘The Effects of Random Taxa Sampling Schemes in Bayesian Virus Phylogeography’, Infection, Genetics and Evolution, 64: 225–30. [DOI] [PMC free article] [PubMed] [Google Scholar]
- Martin D. P. et al. (2015) ‘RDP4: Detection and Analysis of Recombination Patterns in Virus Genomes’, Virus Evolution, 1: vev003. [DOI] [PMC free article] [PubMed] [Google Scholar]
- Mendez J. A. et al. (2010) ‘Phylogenetic History Demonstrates Two Different Lineages of Dengue Type 1 Virus in Colombia’, Virology Journal, 7: 226. [DOI] [PMC free article] [PubMed] [Google Scholar]
- Nogueira R. et al. (1993) ‘Dengue Epidemic in the State of Rio De Janeiro, Brazil, 1990–1: Co-Circulation of Dengue 1 and Dengue 2 Serotypes’, Epidemiology and Infection, 111: 163–70. [DOI] [PMC free article] [PubMed] [Google Scholar]
- Nunes M. R. T et al. (2012) ‘Phylogeography of Dengue Virus Serotype 4, Brazil, 2010–2011’, Emerging Infectious Diseases, 18: 1858–64. [DOI] [PMC free article] [PubMed] [Google Scholar]
- Nunes M. R. et al. (2014) ‘Air Travel is Associated with Intracontinental Spread of Dengue Virus Serotypes 1-3 in Brazil’, PLoS Neglected Tropical Diseases, 8: e2769. [DOI] [PMC free article] [PubMed] [Google Scholar]
- Pan American Health Organization. (1979). Dengue in the Caribbean, 1977. Proceedings of a Workshop Held in Montego Bay, Jamaica, 8–11 May, 1978. PAHO Scientific Publication 375. Pan American Health Organization: Washington, DC.
- Pan American Health Organization. (2015). Dengue. <https://www.paho.org/hq/index.php? option=com_content&view=article&id=9469: dengue&Itemid=40721&lang=en> accessed 28 July 2020.
- Pan American Health Organization. (2019). PAHO/WHO Health Information Platform for the Americas (PLISA): Dengue cases <https://bit.ly/314Snw4>.
- Pan American Health Organization. (2020. a). PAHO Countries and Centers: Subregion. <https://www.paho.org/hq/index.php? option=com_wrapper&view=wrapper&Itemid=2005&lang=en> accessed 28 July 2020.
- Pan American Health Organization. (2020. b). Reported Cases of Dengue Fever in the Americas. <https://www.paho.org/data/index.php/en/mnu-topics/indicadores-dengue-en/dengue-nacional-en/252-dengue-pais-ano-en.html> accessed 22 June 2020.
- Pinheiro F. P., Corber S. J. (1997) ‘Global Situation of Dengue and Dengue Haemorrhagic Fever, and Its Emergence in the Americas’, World Health Statistics Quarterly, 50: 161–9. [PubMed] [Google Scholar]
- Posada D., Crandall K. A. (1998) ‘MODELTEST: Testing the Model of DNA Substitution’, Bioinformatics, 14: 817–8. [DOI] [PubMed] [Google Scholar]
- Rambaut A. et al. (2016) ‘Exploring the Temporal Structure of Heterochronous Sequences Using TempEst (Formerly Path-O-Gen)’, Virus Evolution, 2: vew007. [DOI] [PMC free article] [PubMed] [Google Scholar]
- Rambaut A. et al. (2018) ‘Posterior Summarization in Bayesian Phylogenetics Using Tracer 1.7’, Systematic Biology, 67: 901–4. [DOI] [PMC free article] [PubMed] [Google Scholar]
- Ramos-Castaneda J. et al. (2017) ‘Dengue in Latin America: Systematic Review of Molecular Epidemiological Trends’, PLoS Neglected Tropical Diseases, 11: e0005224. [DOI] [PMC free article] [PubMed] [Google Scholar]
- Reich N. G. et al. (2013) ‘Interactions between Serotypes of Dengue Highlight Epidemiological Impact of Cross-Immunity’, Journal of the Royal Society Interface, 10: 20130414. [DOI] [PMC free article] [PubMed] [Google Scholar]
- Rico-Hesse R. et al. (1997) ‘Origins of Dengue Type 2 Viruses Associated with Increased Pathogenicity in the Americas’, Virology, 230: 244–51. [DOI] [PubMed] [Google Scholar]
- Robinson J. T. et al. (2011) ‘Integrative Genomics Viewer’, Nature Biotechnology, 29: 24–6. [DOI] [PMC free article] [PubMed] [Google Scholar]
- Sahadeo N. et al. (2015) ‘Molecular Characterisation of Chikungunya Virus Infections in Trinidad and Comparison of Clinical and Laboratory Features with Dengue and Other Acute Febrile Cases’, PLoS Neglected Tropical Diseases, 9: e0004199. [DOI] [PMC free article] [PubMed] [Google Scholar]
- Sahadeo N. S. D. et al. (2017) ‘Understanding the Evolution and Spread of Chikungunya Virus in the Americas Using Complete Genome Sequences’, Virus Evolution, 3: vex010. [DOI] [PMC free article] [PubMed] [Google Scholar]
- Shepard D. S. et al. (2016) ‘The Global Economic Burden of Dengue: A Systematic Analysis’, The Lancet Infectious Diseases, 16: 935–41. [DOI] [PubMed] [Google Scholar]
- Simpson J. T. et al. (2009) ‘ABySS: A Parallel Assembler for Short Read Sequence Data’, Genome Research, 19: 1117–23. [DOI] [PMC free article] [PubMed] [Google Scholar]
- Suchard M. A. et al. (2018) ‘Bayesian Phylogenetic and Phylodynamic Data Integration Using BEAST 1.10’, Virus Evolution, 4: vey016. [DOI] [PMC free article] [PubMed] [Google Scholar]
- Tavare S. et al. (1997) ‘Inferring Coalescence Times from DNA Sequence Data’, Genetics, 145: 505–18. [DOI] [PMC free article] [PubMed] [Google Scholar]
- Thompson J. D., Higgins D. G., Gibson T. J. (1994) ‘CLUSTAL W: Improving the Sensitivity of Progressive Multiple Sequence Alignment through Sequence Weighting, Position-Specific Gap Penalties and Weight Matrix Choice’, Nucleic Acids Research, 22: 4673–80. [DOI] [PMC free article] [PubMed] [Google Scholar]
- Tian H. et al. (2017) ‘Increasing Airline Travel May Facilitate co-Circulation of Multiple Dengue Virus Serotypes in Asia’, PLoS Neglected Tropical Diseases, 11: e0005694. [DOI] [PMC free article] [PubMed] [Google Scholar]
- United Nations Development Programme. (2014. a). Human Development Reports: Urban population (%) [Internet]. <> accessed 9 September 2015">http://hdr.undp.org/en/indicators/45106> accessed 9 September 2015.
- United Nations Development Programme. (2014. b). Human Development Report 2014: Sustaining Human Progress - Reducing Vulnerabilities and Building Resilience. New York. [Internet]. <http://hdr.undp.org/en/content/human-development-report-2014> accessed 9 September 2015.
- Vilela A. P. et al. (2010) ‘Dengue Virus 3 Genotype I in Aedes aegypti Mosquitoes and Eggs, Brazil, 2005-2006’, Emerging Infectious Diseases, 16: 989–92. [DOI] [PMC free article] [PubMed] [Google Scholar]
- Villabona-Arenas C. J., Zanotto P. M. (2011) ‘Evolutionary History of Dengue Virus Type 4: Insights into Genotype Phylodynamics’, Infection, Genetics and Evolution, 11: 878–85. [DOI] [PubMed] [Google Scholar]
- Villabona-Arenas C. J., Zanotto P. M. (2013) ‘Worldwide Spread of Dengue Virus Type 1’, PLoS One, 8: e62649. [DOI] [PMC free article] [PubMed] [Google Scholar]
- World Health Organization. (2009). ‘Dengue: Guidelines for Diagnosis, Treatment, Prevention and Control’, Special Programme for Research Training in Tropical Diseases. <http://www.who.int/rpc/guidelines/9789241547871/en/> accessed 9 September 2015.
- Yang Z. (1996) ‘Among-Site Rate Variation and Its Impact on Phylogenetic Analyses’, Trends in Ecology & Evolution, 11: 367–72. [DOI] [PubMed] [Google Scholar]
Associated Data
This section collects any data citations, data availability statements, or supplementary materials included in this article.
Supplementary Materials
Data Availability Statement
All sequences derived in this study are available at GenBank accession numbers KU728183–KU728216 and MN244555–MN244675. Phylogenetic MCC tree files are available at doi: 10.17632/rw6k9phdjz.1.