
Figure 2. Manhattan plot of GWAS results for the discovery stage.
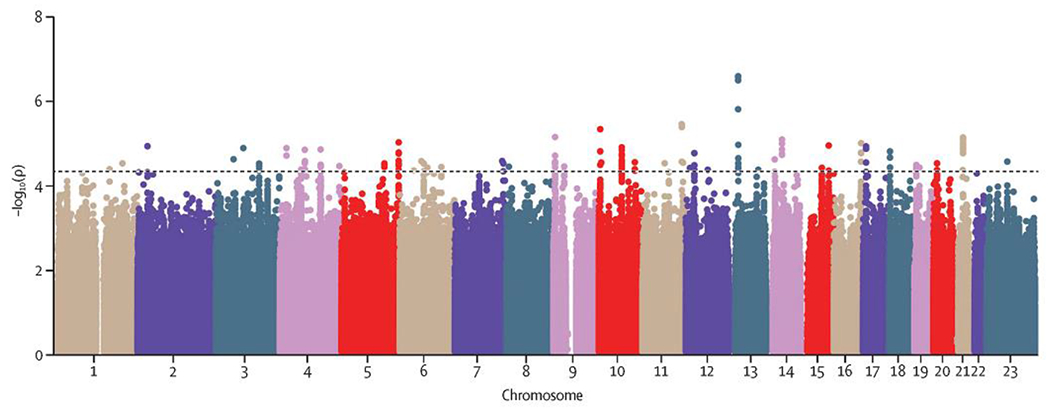
Axes display the -log10 transformed p-values by position in each chromosome. The horizontal line indicates the threshold considered for prioritizing variants for the replication stage (p=5·0×10−5).