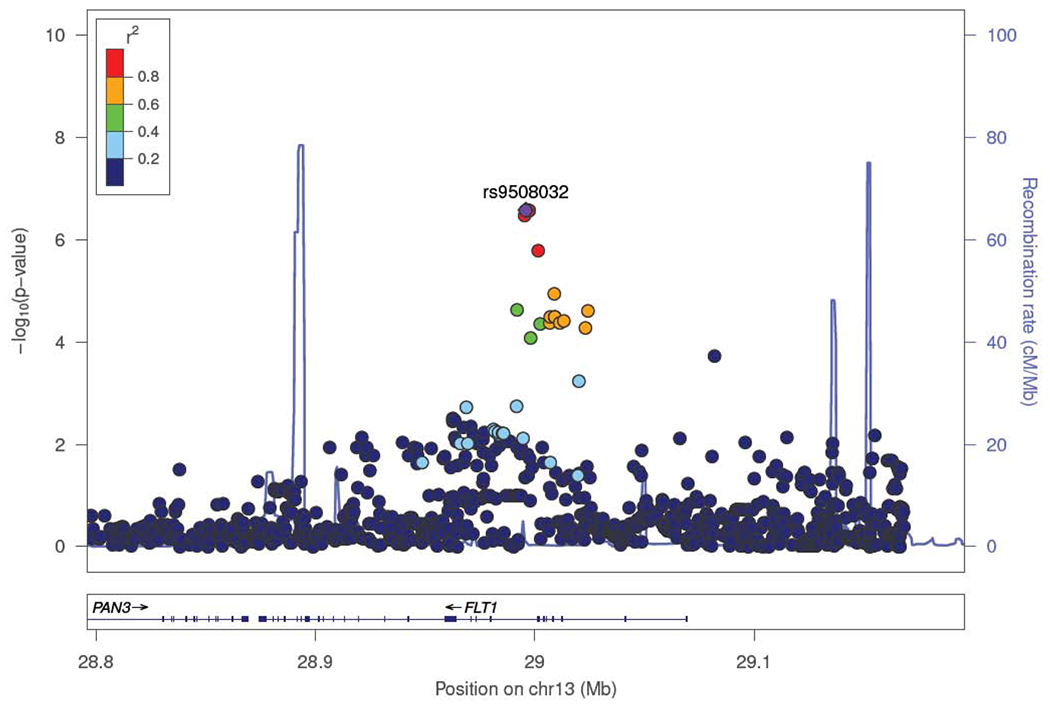
Figure 3. Regional plot of association results for the genome-wide significant locus.

The -log10 transformed p-values for association tests are plotted by position. The SNP rs number indicated on the plot denotes the sentinel SNP. The remaining SNPs are color coded to reflect their degree of linkage disequilibrium with the indicated SNP based on pairwise r2 values from the European population from The 1000 Genomes Project. Estimated recombination rates (light blue line) are plotted on the right y-axis.
